Last Updated on August 31, 2023 by Anastasia
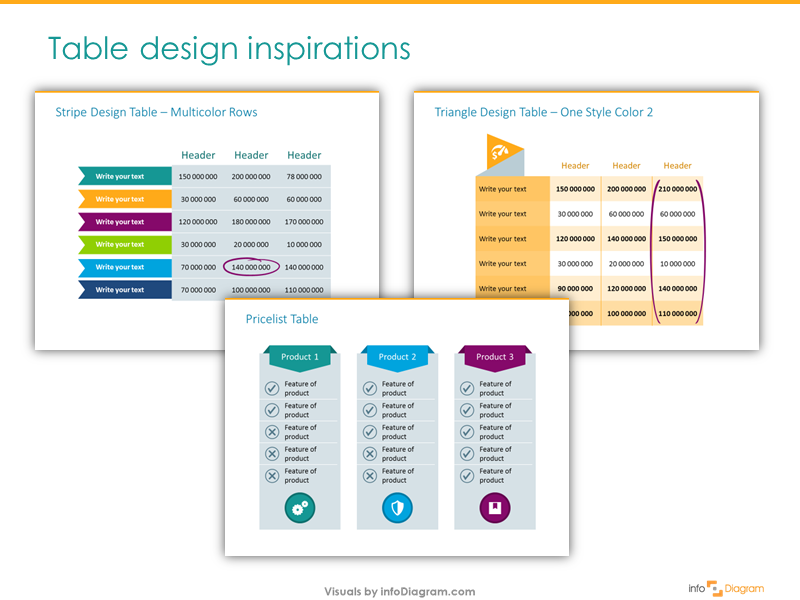
Tables are used everywhere in business – price lists, KPI comparisons, project meetings, quarter review meet-ups, accounting audits… Sounds familiar? Table infographics are one of the most common ways to present data. Making a table in PowerPoint or Excel is simple and quick. However, usually, those tables look pretty basic and boring. It’s time to change that!
Continue reading 4 Steps for a Good-looking PowerPoint Table in a Presentation