Last Updated on March 4, 2024 by Rosemary
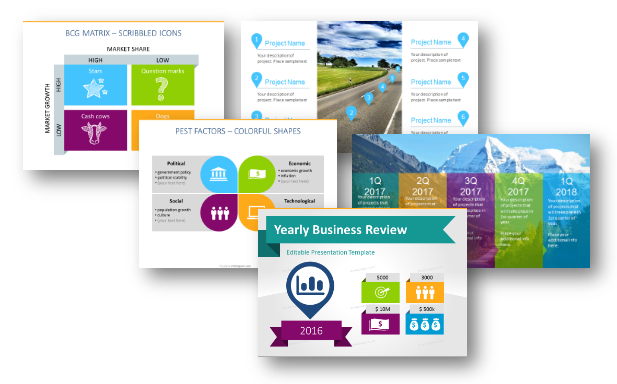
There are dozens of frameworks you can use for strategy analysis, from the classical SWOT model to the BCG matrix. The question is which one to choose and how to illustrate the strategy engagingly and understandably for your audience. As usual, the simplest way is the best 🙂
Transform your business presentations with our expert resources. Discover more on our business performance presentations webpage.
Frameworks for Strategy Analysis and Planning
Below is the list of key tools used for strategic management. Starting with techniques for analyzing the current business situation and market opportunities and finishing with methods for planning the next company moves:
- SWOT analysis
- Porter’s Five Forces
- Business Review
- PEST and PESTEL analysis
- BCG matrix
- SMART goals
- Roadmaps for strategy planning
Choose the strategy model that fits your market and situation. We used those models in our business, however, we are not management consultants ourselves. But as presentation designers, we can advise you on how to present the selected model using simple diagrams.
Check out those books for entrepreneurs and managers, they will help you define the strategy you need and the tools to use.
In this article, you will find various ways to show and illustrate these strategy frameworks.
1. Business Review – visual summarizing KPIs and results
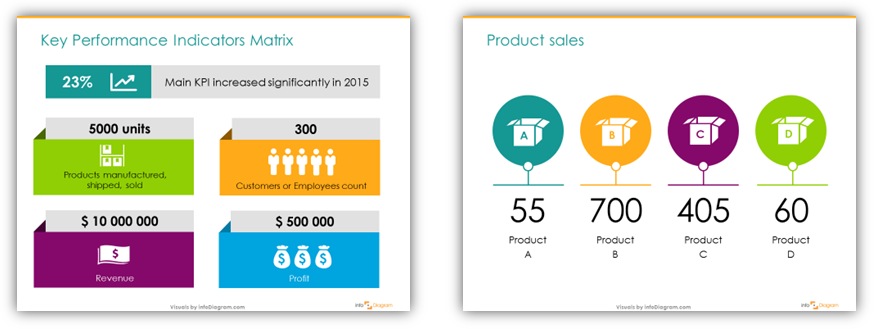
Have you ever thought that financial data can be interesting and not boring? 🙂 There is a way to make financial results more interesting, show sales, production, accounting data, and other KPIs in eye-catching visual form. What is more, the solution is simple: just add a few simple shapes and change plain numbers to colorful, simple infographics.
Example of business review visual slides
If you want to find more inspiration on making similar diagrams, check this blog article “How to Make Attractive Annual Company Review“.
2. SWOT Analysis – diagrams for understanding strong and weak points
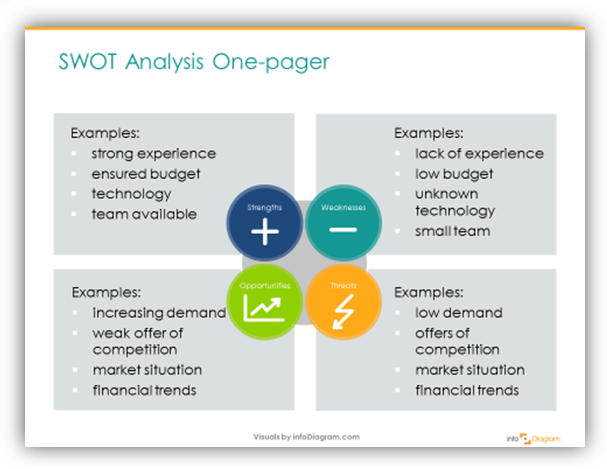
A SWOT analysis is a useful tool for brainstorming and strategic planning. You’ll get more value from a SWOT analysis if you conduct it with a specific objective or question in mind. The crucial step is to move away from usually busy SWOT findings notes to clean and eye-catchy slides presenting all SWOT areas.
Illustration of SWOT one-pager
Do you need to add more details to your SWOT presentation? Reuse the same graphics. A slide costs you nothing so don’t be afraid to split busy slides into several ones. You can assign a color and symbol to each of the 4 SWOT areas to identify them in your presentation.
For more inspiration on using SWOT check this article with examples of how to grab attention to all issues of SWOT presentation. If you prefer conducting your SWOT analysis online, there are also a bunch of mobile and cloud apps for personal or company SWOT as well.
3. PEST Analysis – testing your external environment
This is a great tool to use in tandem with SWOT. It is useful for understanding market growth or decline, and as such the position, potential, and direction of a business.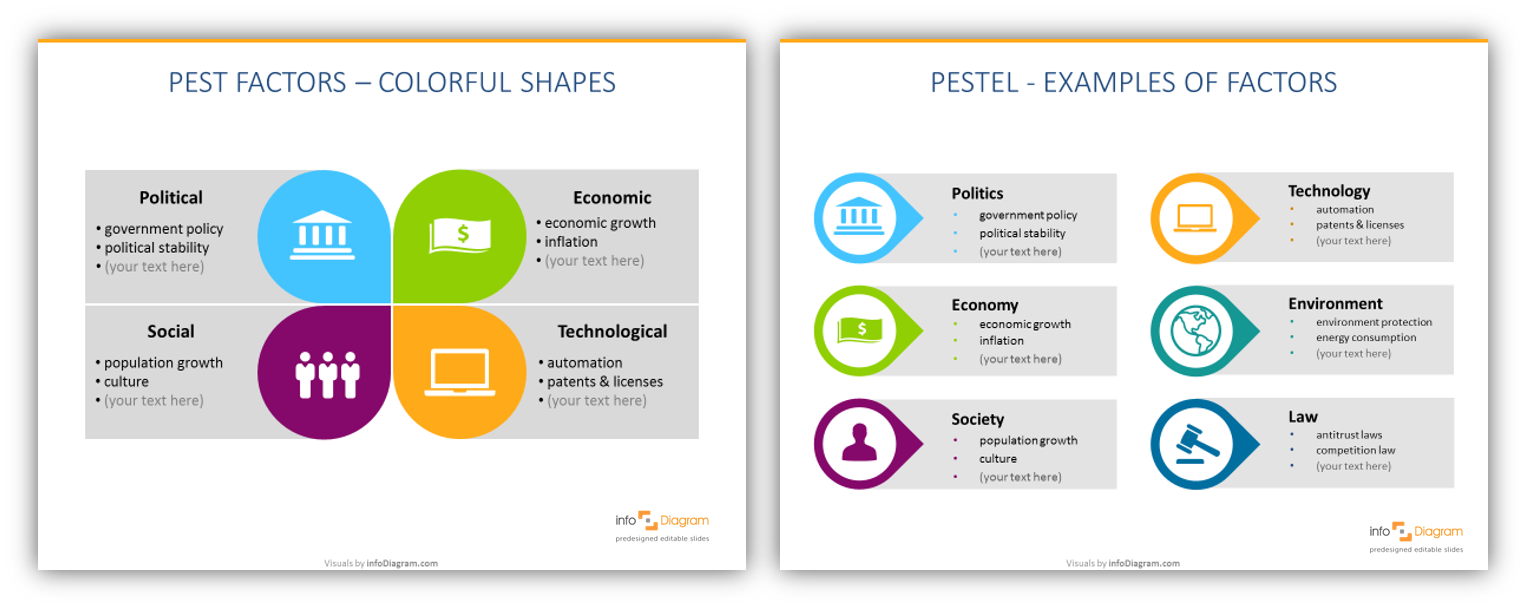 Slide illustrations of PEST analysis diagrams
PEST analysis is commonly used in strategic and marketing planning or product development. If you are looking for more PEST visualizations, read our article on How to create a great PEST slide or presentation.
4. Porter’s Five Forces – a framework for identifying a company’s environment
Porter’s Five Forces is a simple but powerful tool for understanding where power lies in a business situation. This model helps you understand both the strength of your current competitive position and the strength of a position you’re considering moving into.
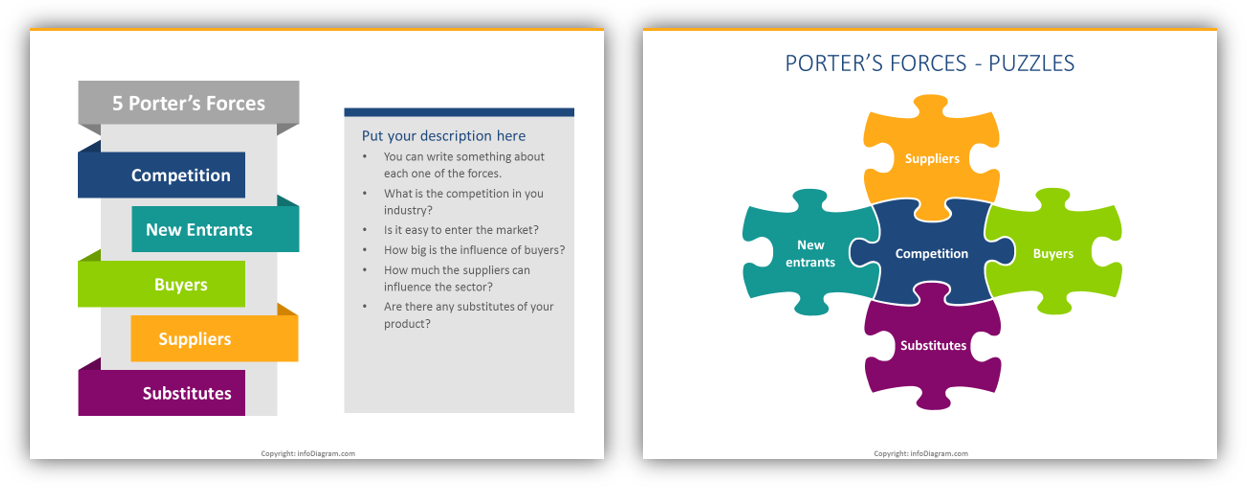 Porter’s Five Forces Marketing Model Diagram examples
Here are some ideas on how to present Porter’s 5 forces creatively. You may also search for a more detailed explanation of how to analyze the competitive environment in this article.
5. BCG Matrix – identifying customer segments
BCG matrix is designed to help a business consider growth opportunities by reviewing its portfolio of products to decide where to invest, discontinue, or develop products. More ideas on how to present the BCG matrix.
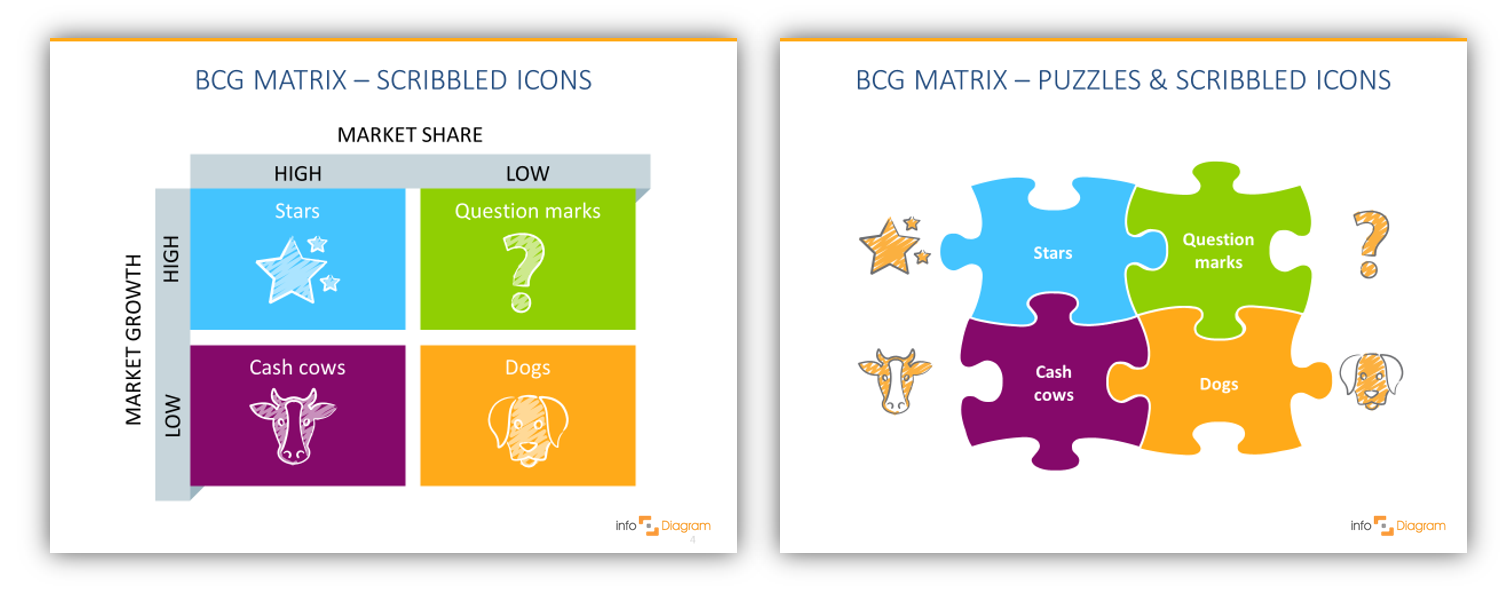 Illustration of BCG Matrix by 2×2 diagram or puzzle shapes
6. SMART Goals – ensuring your objectives are clear and reachable
To set effective goals, use the S.M.A.R.T. method of defining them. If you present the goals in nice eye-catching ways, you can reach better engagement by your audience.
Design templates of SMART goals benchmark tables
If you write your plans and targets in text only, people will not be eager to read and remind them often. On the other side, if you present them in a clear aesthetic way, people will remember them longer (we wrote more about it in this blog How to make SMART goals visually engaging).
7. Roadmaps – presenting a long-term vision
A well-designed strategic roadmap is like a GPS for your business. It’s one of the best tools to lift the fog and make your vision clear for everyone on the team.
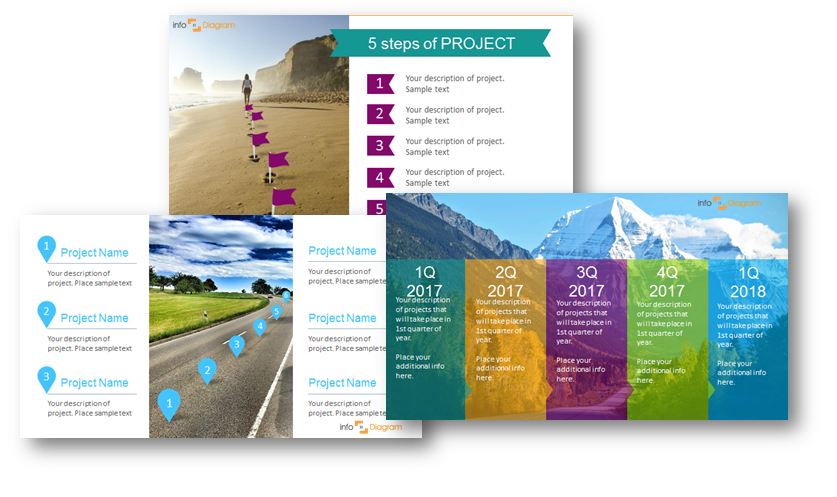
Roadmap slide deck illustration for project planning
I recommend using those five steps (Forbes article) to create an effective long-term or short-term strategy:
- Check where you are
- Prioritize what’s important
- What to achieve
- Who will do it, who’s accountable
- Review
Once you have it, it’s time to pack it into a nice engaging presentation design. See the blog Three Creative Ways to Do a Roadmap slide.
Whatever your planning level and context are, the visual roadmap can be one of the best weapons in your communication arsenal.
Those are seven essential tools for strategic planning and implementation. Check specific framework graphics in the infoDiagram business diagrams collection to find what you need.
You may want to create your own slides and use more models than we suggested. For this purpose, we recently created an infographics do-it-yourself collection: Flat Infographic Presentation Templates.
For more inspiration, subscribe to our YouTube channel:
Explore our blog to get ideas for Strategic Planning Presentations.
Conclusion – Make Your Strategy Visual
As you can see, all those strategy tools can be pretty easily visualized. Even if using plain simple PowerPoint shapes – 4 colorful rectangles for the matrix or a wide arrow for roadmaps.
Here’s what a professional management consultancy principal told us about using such visual frameworks in her work:
“As a management consultant, it is important for me to visually display my slides in a way that not only appeals to my clients, but also sets the quality of my work apart and gives more life to my message.”
Astrid Malval-Beharry from StratMaven Operations Consulting Firm
Stay updated
Get new presentation ideas and updates sent directly to you! Plus, if you sign up for our free newsletter now, you’ll receive a Creative slide design guide for free, as well as hand-drawn shapes you can start using right now.
What tool do you use the most in the strategic analysis? Drop us a line in the comments 🙂