Last Updated on January 12, 2022 by Anastasia
We prepared a set of icons for visualizing economic and industry-specific topics: administration, public services, science and culture sectors. Illustrate the industry sectors charts and slides with flat catchy symbols and diagrams for a better understanding of the topic.
This is an overview of visual symbols collection (plus do-it-yourself infographics) for various public industries, which can easily be added to various office documents, including PowerPoint slides, Word documents, web pages or infographics.
You can get a collection of Public Sector, Administration, Science & Culture graphics here. Or click any picture below to see the reusable source graphics.
Why use consistent industry icons set?
Some common problems you can face while searching for various industry sectors images are:
- Hard to find a specific icon for your public-related industry
- The inconsistent look of images if you use several resources
- Unclear legal rights for using the icons from the Internet, e.g. author attribution is needed, or pictograms are only for non-commercial private use.
- Symbols may not be editable in PowerPoint
- Icons of lower visual quality (distorted edges)
With our infoDiagram Industry Icons set, we address all those issues. Check the example slides below.
Illustrate Industry Sectors Charts with Symbols
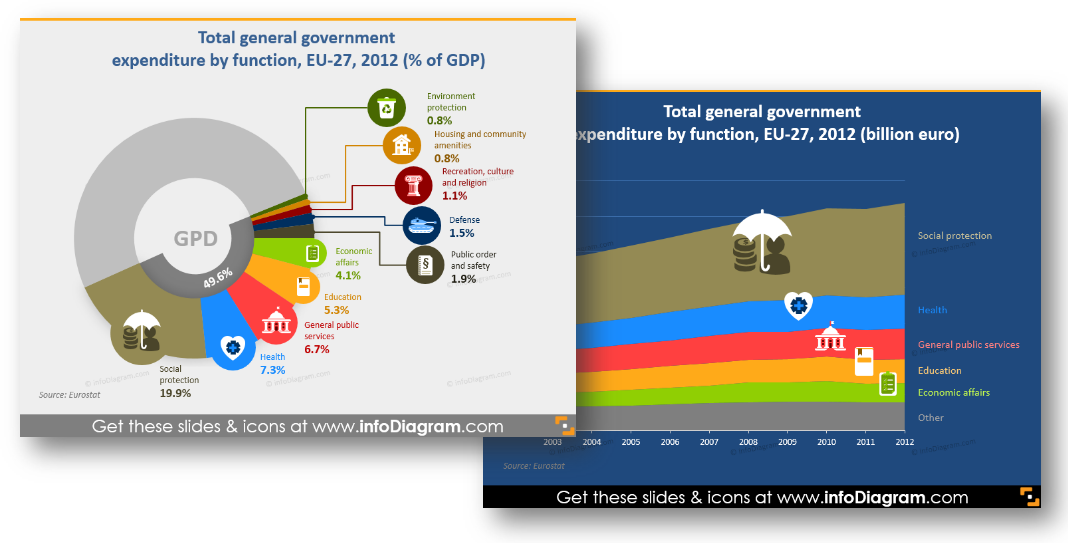
Using simple symbols on the diagram slides will help you to catch and keep the attention of your audience on the points you want, especially if you have to present a large amount of statistical data.
See those examples of pie and line charts:
Besides adding the icons to PowerPoint slide, you can use them also in other documents – eBooks, Excel sheets, also Keynote, Prezi and other tools. For MS Office apps a simple copy & paste of the data chart or symbols will work. For other tools (Canva, Prezi..) saving icons as an image and adding them as a picture will do the work, too.
What’s inside Public Sector, Administration, Science & Culture icon set?
The collection contains various graphical elements for PowerPoint – industry sectors symbols for PowerPoint. You can choose colors to correspond with your brand or the color scheme and layout of your presentation. Icons remain razor sharp also if you resize them, unlike bitmap pictures.
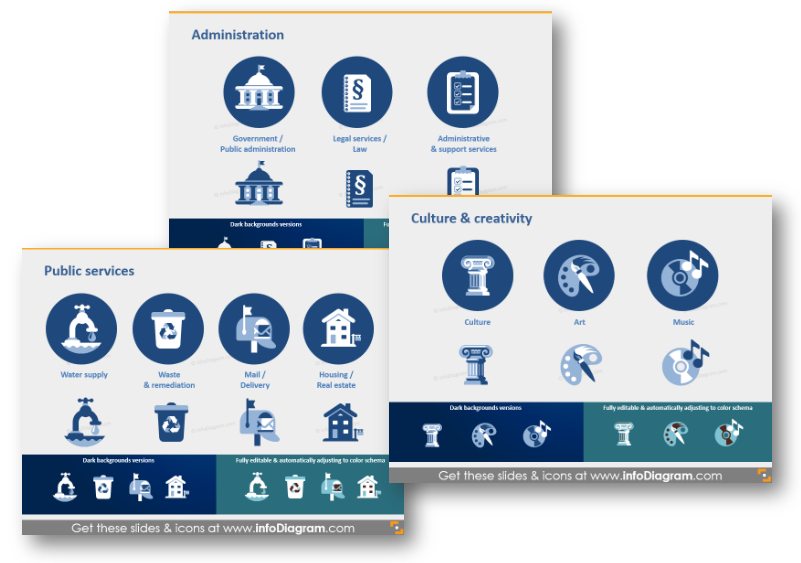
The icon collection consists of:
- Administration sector icons: Government / Public Administration, Legal services / Law, Administrative and support services
- Social Services: Insurance, Social protection, Healthcare & military defense sector symbols
- Public services sector icons: Water supply, Waste and remediation, Mail / Postal Delivery, Housing / Real Estate symbols
- Education, Science, Research, Space symbols
- Culture, Art, Music symbols
- Media and entertainment industry symbols
- Industry Icons usage examples (Do-it-yourself infographics)
- Government expenditure by function, EU (line chart with icons illustration)
- Government expenditure by function, % of GDP, EU (pie chart with icons illustration)
All icons and chart examples above are from our infoDiagram PowerPoint Diagrams collection. It contains icons for visualizing economic and industry-specific topics, which can be easily edited and added to other presentation.
See the Industry Icons Collection
Public Sector, Administration, Science & Culture graphics collection is a part of wider industries icons bundle, which contains various industry segments pictograms. If you like modern outline style more, then take a look at our fresh Industries Outline Icons Bundle.
I have paid for templates but am not sure how to access the editable slides
Hi Maureen,
thanks for getting to us.
We just replied you through the mail.
If you need any help, just drop a line.