
Last Updated on March 19, 2024 by Anastasia
Does your presentation contain the idea of hidden versus visible? Consider using an analogy of an iceberg image. This blog illustrates where and how you can use the iceberg model diagrams. Make your presentation easier to remember by explaining the visually invisible roots of various problems.
Explore our Business Performance PPT Reports category on the website for more resources to boost your presentation impact.
While we were designing the iceberg diagrams, we wanted people to focus on the content of their slides, not on creating the graphics. One of the first user’s feedback is:
The iceberg model helps me as a trainer to show how a huge amount of hidden elements is driving people’s behaviour in a diverse range of contexts.
It is a clear yet colorful metaphor, which makes it easy for participants to comprehend the context, and at the same time makes it memorable.
Mirna Smidt, Croatia, trainer of positive psychology
and professional skills at mirnasmidt.com
All presented slide examples are available in the Iceberg Model Template deck.
The Iceberg Model Principle
It states that in many (if not most) cases only a very small amount (the ‘tip’) of information is available or known about a situation or phenomenon, whereas the ‘real’ information or bulk of data is either unavailable or hidden. The principle gets its name from the fact that only about 2/10th of an iceberg’s mass is seen outside while about 8/10th of it is unseen, deep down in the water.
The iceberg principle can be used in various areas, for example:
- while talking about culture and literature
- presenting cost models
- revealing hidden conscious levels in psychology
- system thinking
- when doing various soft-skills training courses
3 Common Cases to Use the Iceberg Analogy
Freud Iceberg Theory
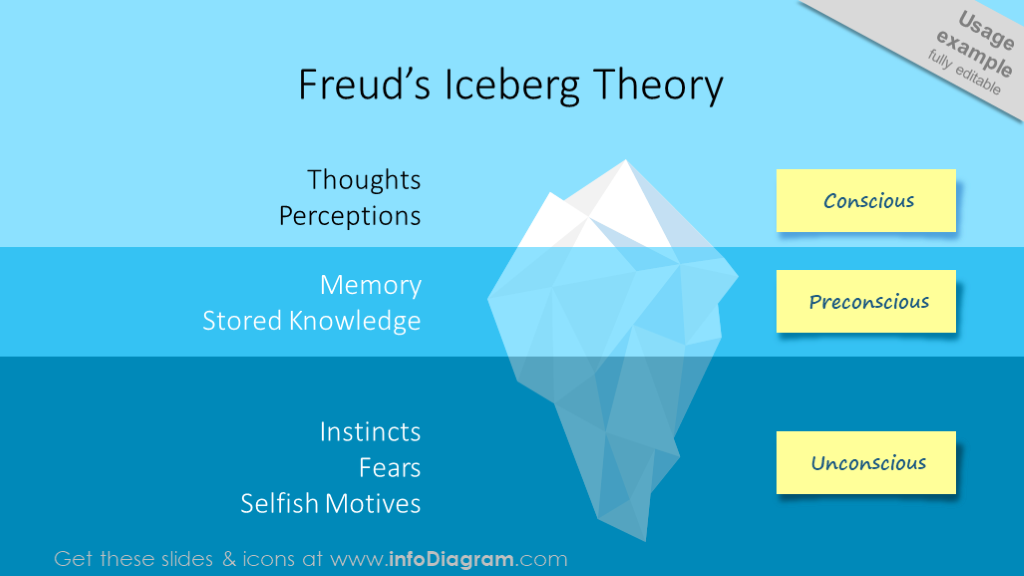
One of the first things that come to mind when you hear the words ‘iceberg analogy’ is Freud’s Iceberg Theory. According to Freud, the unconscious mind is the primary source of human behavior. Like an iceberg, the most important part of the mind is the part you cannot see.
The model is still widely used in psychology and we decided to illustrate three mind levels with a simple iceberg diagram and sticky notes: Conscious, Preconscious, and Unconscious behavior.
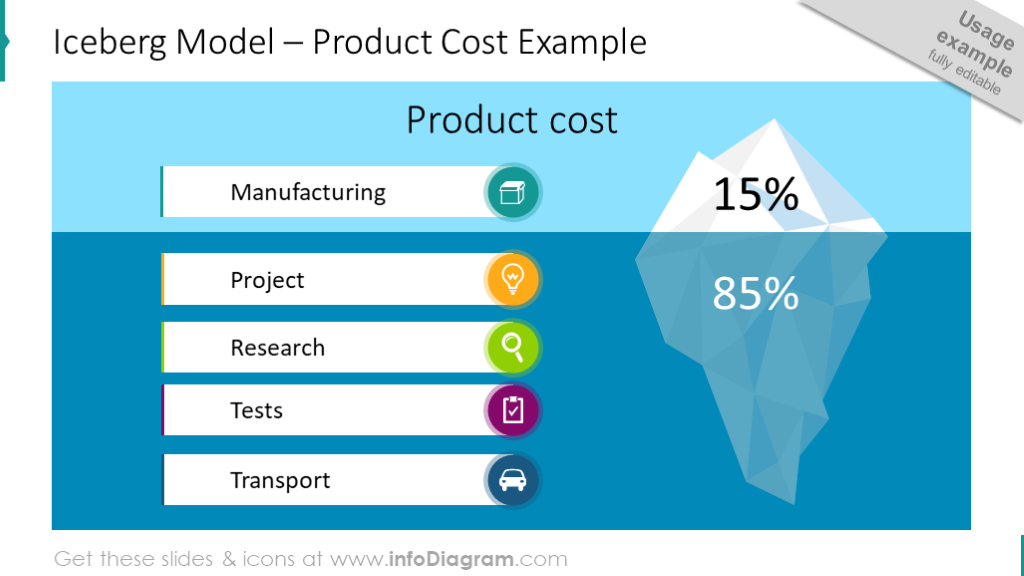
Hidden Product Cost Illustration
Another case where the iceberg diagram can be used is product cost illustration. Manufacturing cost takes 15% of all expenditures, whilst project, research, tests, and transport cost – another 85%.
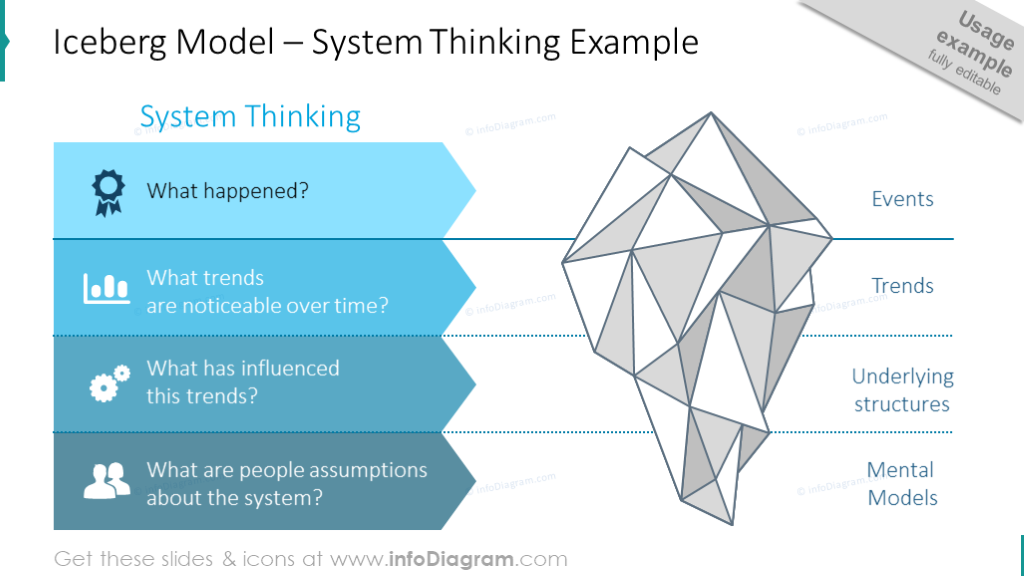
System Thinking Iceberg Model Diagram Example
Another area where the iceberg’s hidden levels of metaphor can be used is system thinking. The discipline of systems thinking is more than just a collection of tools and methods – it’s also an underlying philosophy.
The classical system thinking model can be represented as an iceberg, consisting of the following 4 levels:
- Events – What happened?
- Trends – What trends are noticeable over time?
- Underlying structures – What has influenced these trends?
- Mental Models – What are people’s assumptions about the system?
Where Else You Can Use an Iceberg Analogy
Apart from the described cases, you can apply such diagrams:
- talking about different culture models – what traits and behaviors are above and which are below the visible surface
- illustrating iceberg theory in literature – analyzing writing style for example (Ernest Hemingway introduced the model to the literature world)
- while soft-skills training you may apply iceberg for leadership model or interpersonal communication levels.
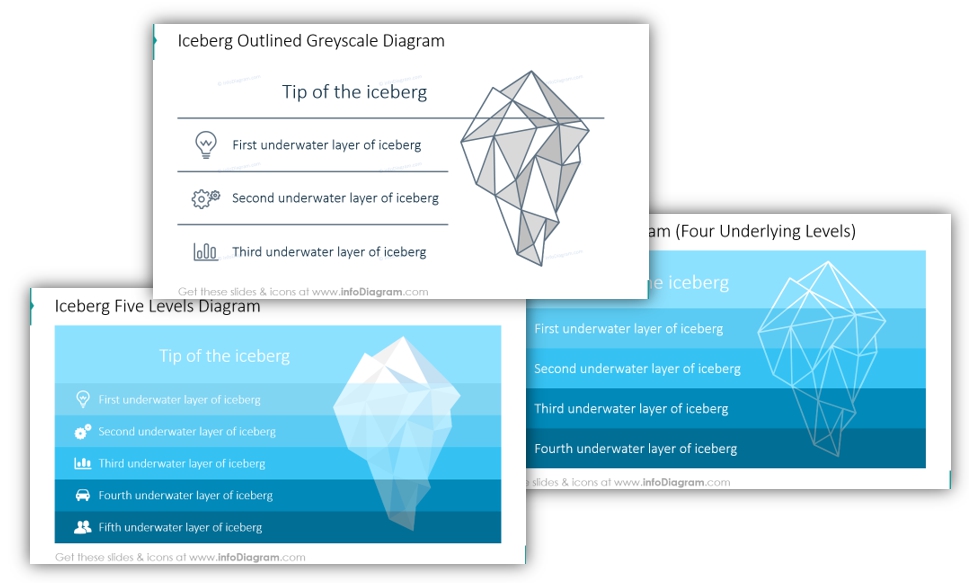
To show your ideas, here are some iceberg diagrams examples:
Iceberg diagrams can be used widely in business-related presentations. Hope you got inspired by our examples 🙂
Check our video guide on how to illustrate various business concepts using iceberg diagram:
Resources: Iceberg Model Diagrams
If you want to save time, you can use the pre-designed diagrams from our infoDiagram collection, we have designed. Optionally you can create a simple form of an iceberg, using polygons or even a simple triangle.
Using the infoDiagram iceberg diagram template, you can easily adapt and reuse the ‘icebergs’. The Iceberg PowerPoint template includes:
- 10 iceberg diagrams over various background layer stripes. We designed also a lighter version of the outline iceberg that is a more subtle illustration, in case you want your slides to be less eye-catching. This format is also better if you want to print the presentation.
- 26 vector icons representing levels of the system thinking model (observations, trends, influence, people’s assumptions) and hidden product manufacturing costs levels such as transport, research, and testing
- 3 predesigned examples of Freud’s iceberg theory, System Thinking Model, and Product cost iceberg
It’s easy to modify the iceberg diagram, add or remove layers, change descriptions, and replace icons to fit the model content. On the last slides, you have a set of several icons you can reuse or you can extend the icon collection by getting PPT icon set bundles (see Related Diagrams section).
The colors of iceberg shapes and icons are easy to change, thanks to that all graphics are in vector format. So you can adapt the slide content to your preferred branding colors. Just ensure the proper contrast of text and background to stay readable.
You can see the full slide deck by clicking the button:
If you want to get a more extensive set of visual slides with more charts and diagrams, check this infographics PPT bundle.