
Last Updated on March 1, 2023 by Peter Z
Do you want to add an eye-catching intersection visual to your presentation? In this blog, we share a few inspirational ideas for creating a Venn diagram to express common or overlapping concepts visually in PowerPoint.
Venn diagrams are a perfect tool for illustrating the logical relationships between two or more sets of items. This template will help you illustrate overlapping information and show the common points between the presented categories. Using a diagram visualization your slides will provide clarity and simplicity.
Remark: You can get all the presented diagrams and icons from the Venn Diagram Template Deck.
What are Venn diagrams and how to use them
You probably heard first about Venn diagrams in primary school math class. I do. They represented unions of numbers sets. Later those diagrams got forgotten.
Just later, when I started doing slide design, I rediscovered them as a great presentation visualization tool to be used also in the business world, for problem-solving presentations, or for highlighting product characteristics.
Those overlapping circles are simple enough to get the attention of your audience and explain more complex issues, assuming there is some common part. Venn diagrams are easy to modify: you can add text inside circles or replace it with a few quick clicks. That’s why they are universal visualization tools to be used in a wide area of presentations, technical webinars, and meetings, or for more high-level managerial conference keynotes.
Making creative Venn charts infographics does not have to be complicated. Here are a few tips to help you make more advanced Venn infographics quickly:
1. Add Vivid Colors to Your Intersection Diagram
Below you can see an example of the boring mono-color Venn chart and an upgraded one. Using bright colors will help to catch the attention and focus of your audience on the main – intersection part. You can illustrate a few items and the connection logic between them using this diagram. Play with adding wider white contour to the Venn circles to show borders more clearly.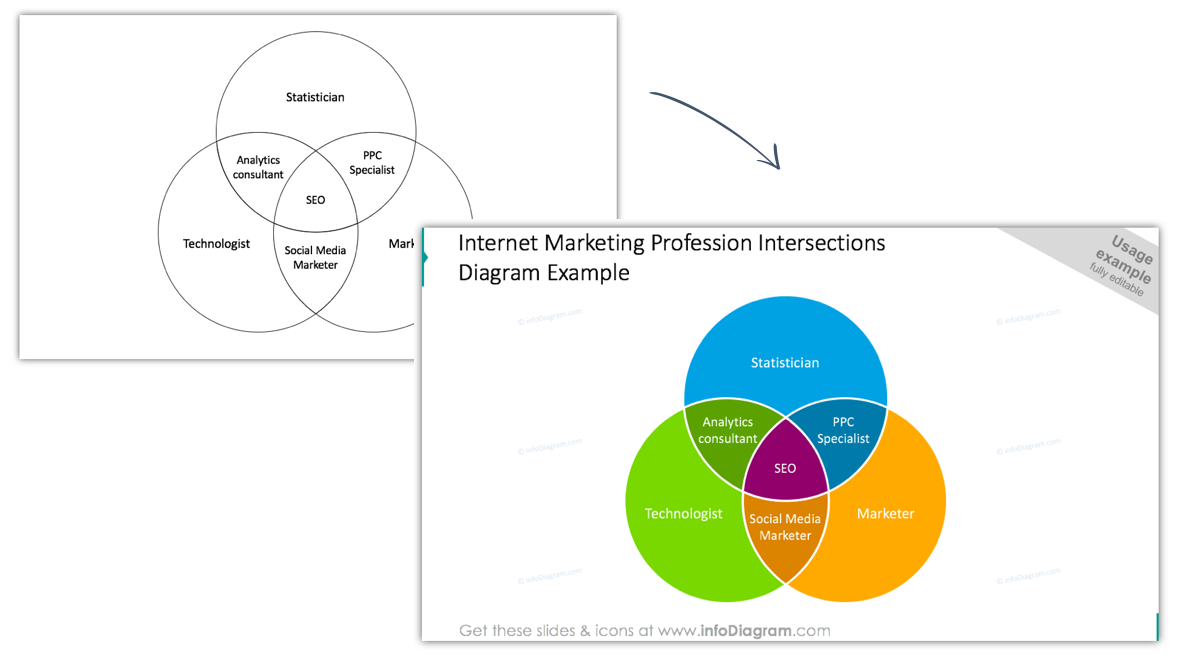
2. Use Icons to Illustrate Intersection Areas
Presenting a Venn chart with flat symbols is a good opportunity to make an easy-to-understand and visually stimulating slide. By adding simple flat icons you can make a visually appealing presentation without overloading your audience with text information.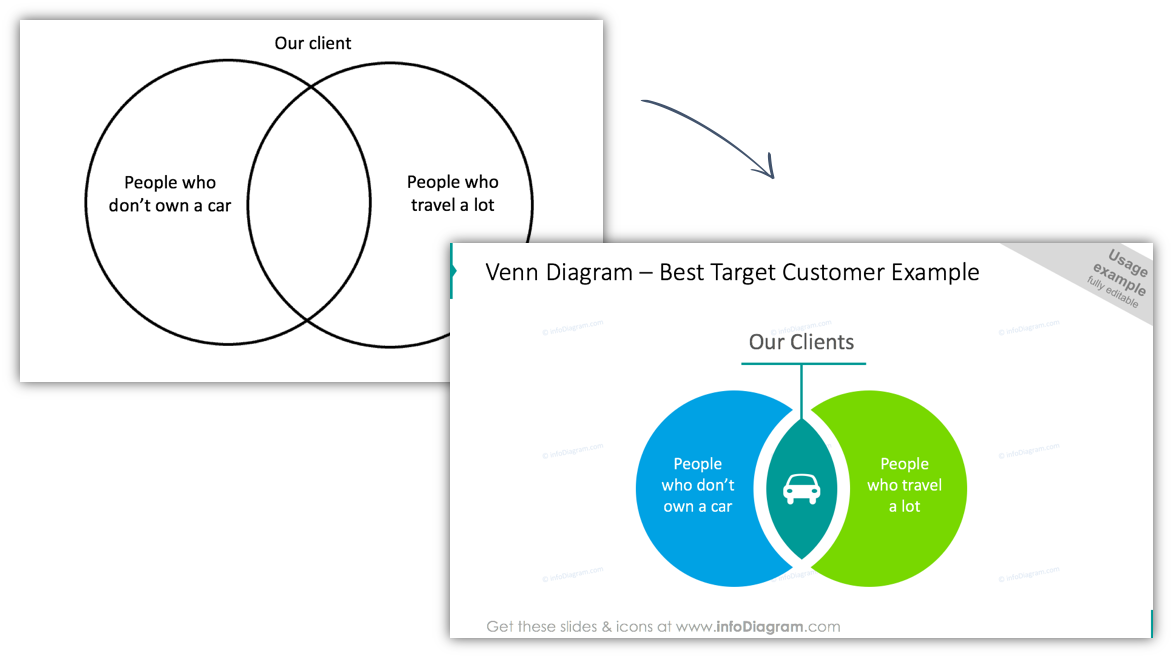
3. Illustrate the Venn Diagram with Semi-Transparent Circles
If you want to make a presentation outstanding but still keep it simple, this kind of graphic will be perfect for you. Below we presented a Venn diagram illustrated with semi-transparent, colorful circles. We also propose you illustrate text boxes with a description. Divide them with a line or text placeholder. It helps you to avoid clutter on your Venn graphics slide.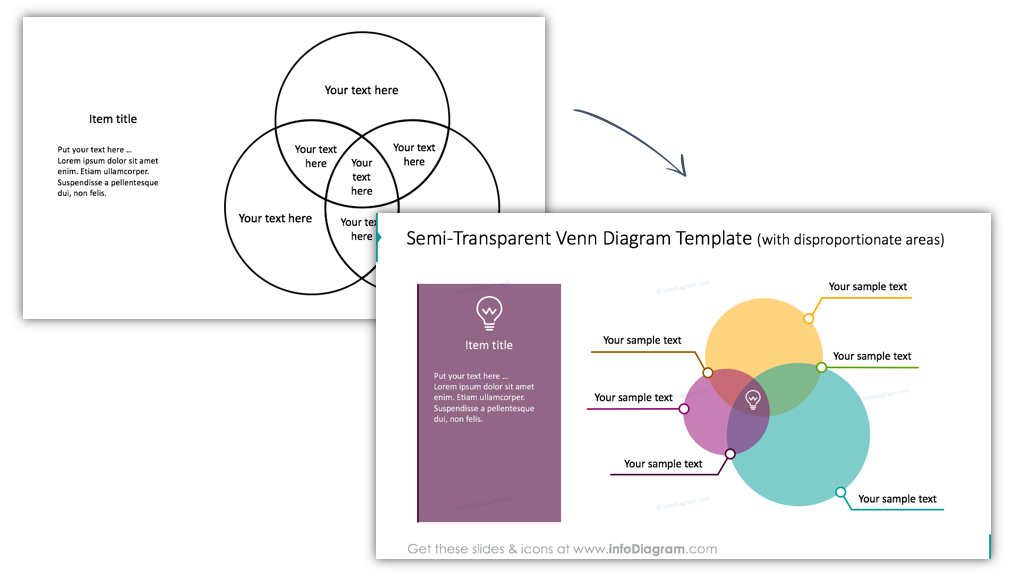
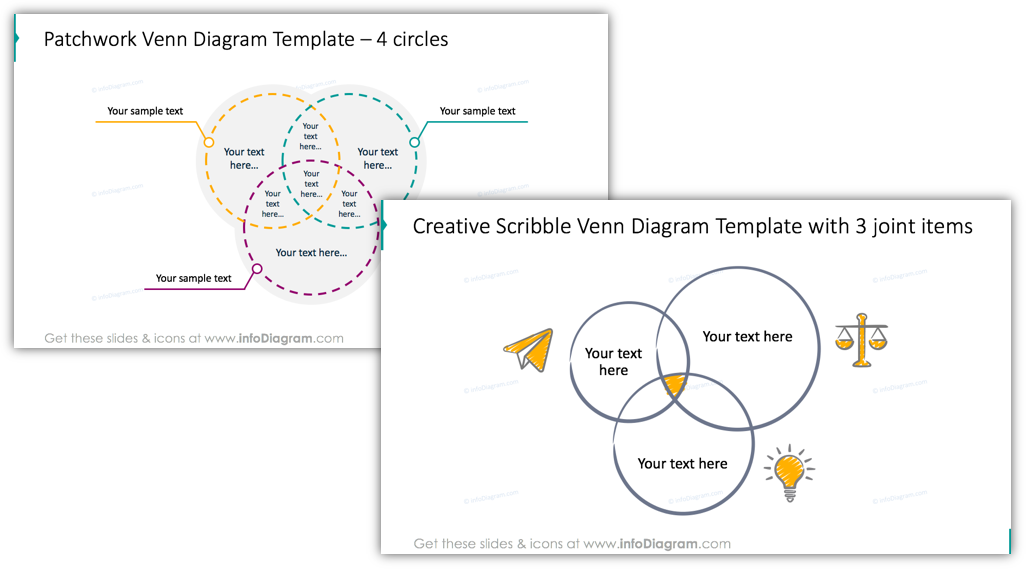
4. Creative Venn Diagrams with Patchwork and Scribble Graphics
Below you can see a few examples of the Venn charts with unique and interesting designs. They do not have the same visuals as the others. 🙂 Using dotted or scribble lines will help you to stay professional and creative at the same time. Using vivid line colors and hand-drawn icons will help your audience concentrate on the topic.
Takeaway: Venn Diagrams are a tool for engaging intersection slides
We demonstrated layouts that will help your presentation look innovative and keep up with trends. You can reuse one of our diagrams or create your own graphics using the tricks we shared. Thanks to these tips your slides won’t be plain or boring.
For more ideas on using diagrams to replace text, check out this page. I would also recommend this book by Dan Roam: On the Back of the Napkin.
Graphical Resources: Modern Venn Intersection Diagram
To help you create intersection charts on sides, we designed an editable PowerPoint Venn Diagram to present overlapping relationships in a presentation.
The Venn Intersection Collection includes:
- 16 Venn diagrams, with 2, 3, 4, and 5 circles overlapping in each set. We designed, filled, and outlined diagram versions, that are lighter (better for printing).
- 25 vector icons representing common business concepts such as people, value, commerce, and ideas.
- 5 predesigned examples of problem visualization by Venn diagrams – customer satisfaction, best target client profile, personal savings, online marketing skills, and coffee types.
You can see the full slide deck by clicking the button:
If you want to get more extensive and creative graphics, check our Flat Multicolor Icons for Business.
How You Can Use the Venn Diagrams Template:
- Venn diagrams represent intersections between several categories. The most simple is a Venn diagram showing two sets A and B and their common and distinctive parts. The union of sets can represent joint characteristics of several problems or categories. This way you can explain complex problems and show easily what is the key feature of your problems – what the main connection is.
- You can present how to solve problems using those Venn intersection diagram illustrations. This works well whether you have 2,3, 4, or 5 attributes. A Venn diagram for over 6 categories can get too complex and become hard to read, so keep that in mind when planning yours.
- You can use a plain Venn diagram as a printable worksheet to write inside. If needed, you can remove colors and fill transparent sets to get a simple outline.
- On social media Venn diagrams have been used to show some popular memes such as options for design demand: you get either a good design or a cheap one or a fast one. Not all three at the same time :).