Last Updated on February 26, 2024 by Rosemary
If you are looking for a creative way to show a repeating process then you’ve come to the right place. Below we’re presenting a few modern ways of cycle diagram design you can easily create in PowerPoint.
Elevate your business performance presentations with our curated resources – visit our financial performance PPT reports webpage.
Circular processes are flowcharts expressing a recurring set of events. With a few design tricks, you can create simple infographics that will make your presentation look professional.
The diagrams with cycle arrows that you will see contain various numbers of steps or levels, and they can be illustrated with icons or have a minimalistic outline flow chart look.
All example slides can be found in the Cycle Diagrams & Wheel Charts PPT collection.
Cycle Diagram Design Ideas
We’ve put together a bunch of cycle diagram design examples to show a continuing sequence of tasks, stages, or events in a circular flow.
#1: Outline Loop Process Chart
Here we used a six-stage loop as an example. Each stage is illustrated with various colors and icons so it’s easier to distinguish them one from another. This is a minimalistic kind of cycle, it will suit you if you don’t need to put many descriptions around.
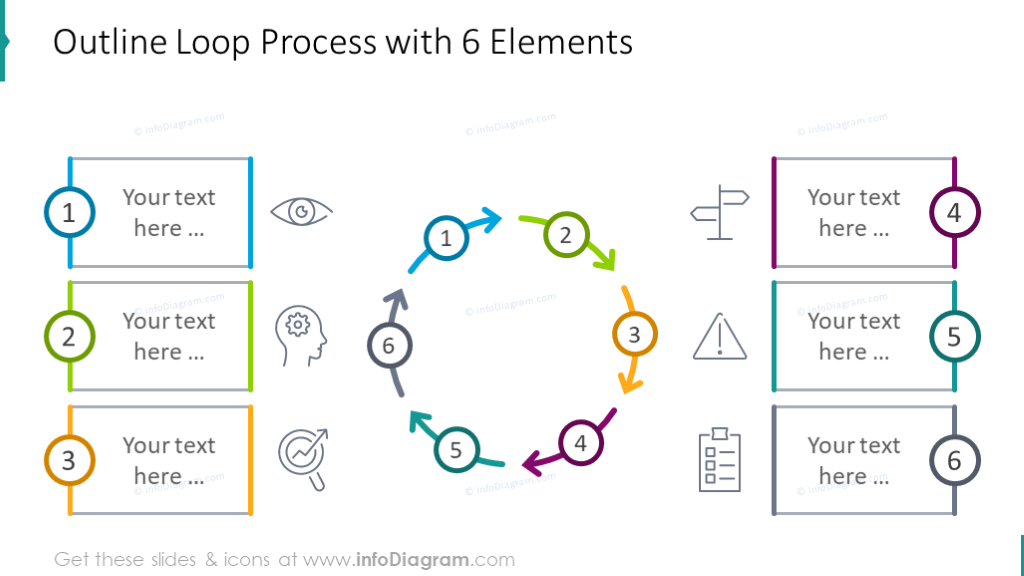
Design tip: To keep your slide content readable, we suggest putting up to 6 or 7 stages on one chart. If you need to include more, use a second chart or create another level on the same slide.
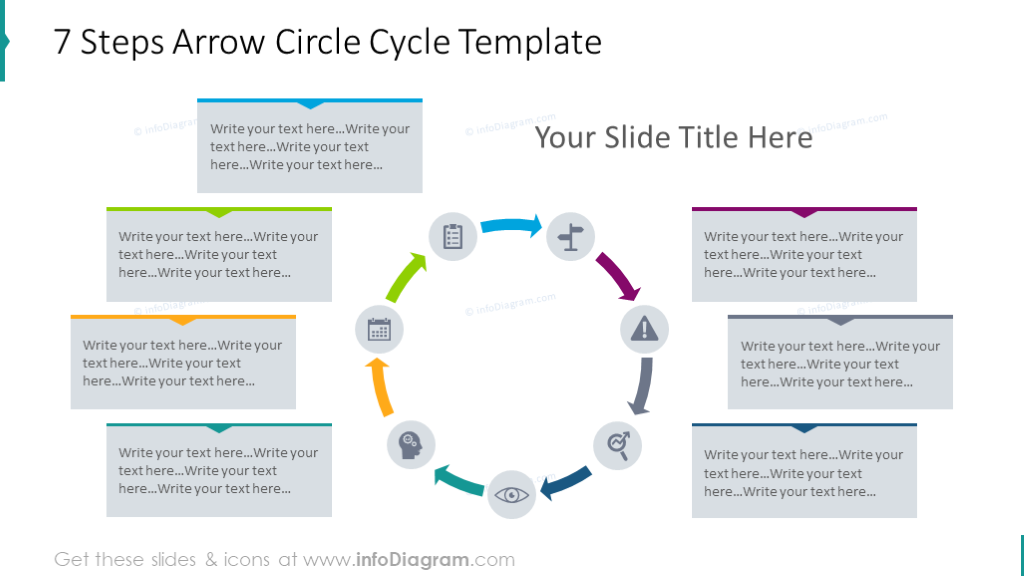
#2: Arrow Circle Cycle Template
Even though there are seven stages, the slide still looks decluttered. This is because we put symbols instead of numbers in the wheel and saved a place for the description of each step.
#3: Chevron Ring Loop
In the next example, we used chevron arrows and a big icon of a diamond in the loop center. The diamond symbolizes the added value.
The simple line call-outs give a modern look to the slide overall.
If you need a different number of stages, you’ll find those at the end of the cycles slide deck. We have included similar loops with various numbers of stages.
If you are a fan of more creative styles that stand out, look at the following example: we put three colors in the chart as a background and illustrated them with scribble icons:
#4: Flat Arrow Cycle Simple List
If the cycle you want to present can be associated with a list, the following template is just for you. It’s a clean wheel chart with a numbered list legend on the side.
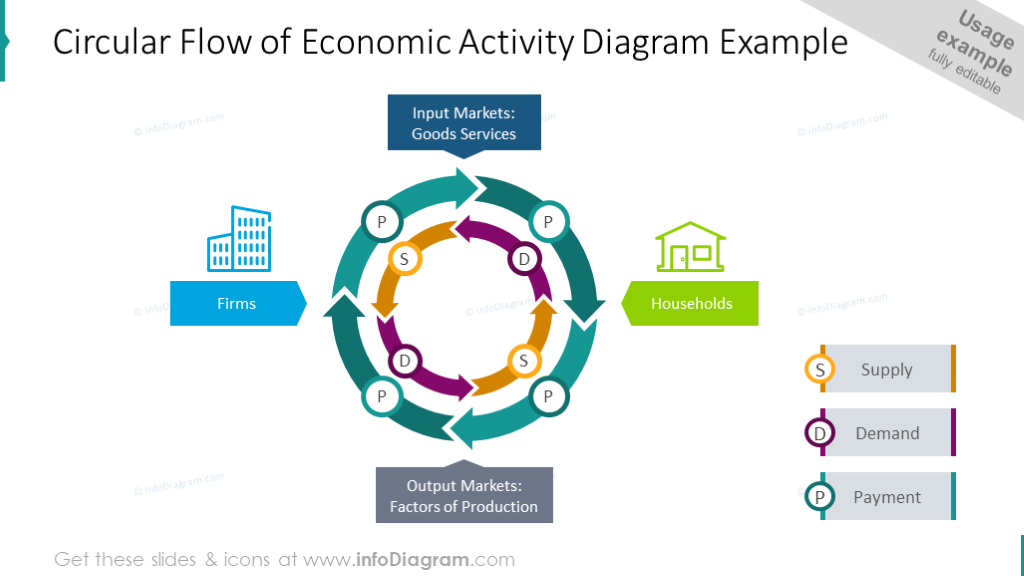
#5: Circular Flow Wheel Chart with Two Directions
Two-level cycles such as this are good to use when you want to explain a more complex topic with embedded cyclic processes. For example, a flow of economic activity is shown here. We suggest illustrating key categories with simple text and outlined pictograms, paint arrows in different colors expressing various things. Explain your symbols, pictograms, and colors in a legend on the side.
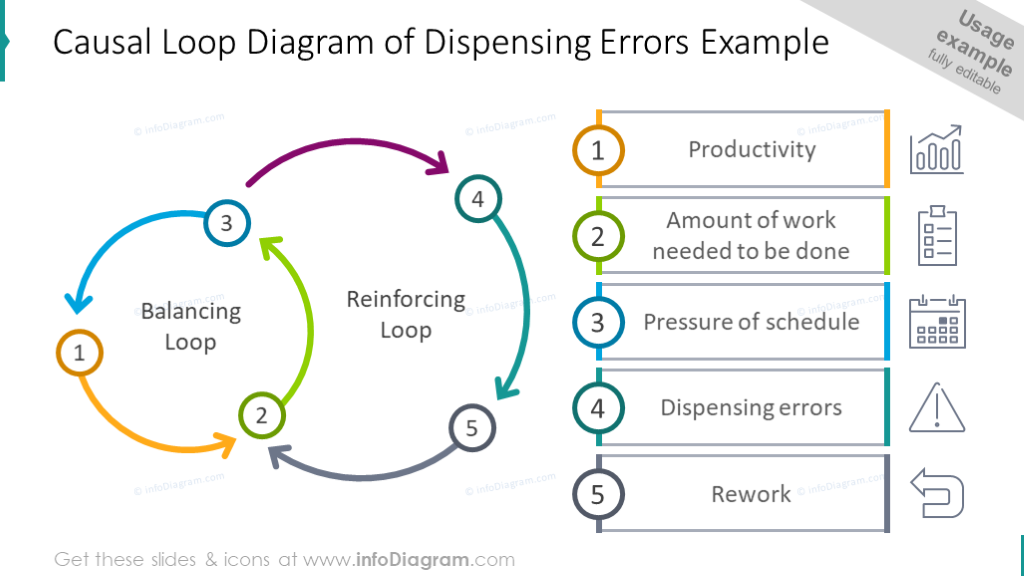
#6: Causal Loop Diagram
If you need to present two interconnected cycles, see the following example. There’s no need to create separate slides, you can show them with outline arrows and short descriptions with icons.
Check our video guide on how to redesign the closed cycle process step by step:
Design Ideas Summary
Those were 6 ideas of cycle diagram design:
- outline loop process chart
- arrow circle cycle
- chevron ring loop in two design versions: flat and creative
- flat arrow cycle list
- circular flow wheel chart with two directions
- causal loop diagram
Before we finish, let us share some design advice to keep your cycle charts looking modern:
- Use simple design styles – flat filling, light or no outlines. Avoid old-looking gradients or 3D effects.
- Don’t overload the slide with text. Only write keywords, and leave the details for your speech or for notes.
- Be consistent in styles, use one color palette, 1-2 fonts, and one style of icons.
- Don’t overdo it with decorations. A simple color line will do, as you saw on the slides above.
- Remember to have big enough margins. Don’t put your presentation elements (text, diagrams, icons) too close to the slide edge.
Resources: Cycle Diagrams & Wheel Charts
We hope our blog gave you some inspiration 🙂 You can recreate such cycles from the examples above or get ready-to-use PPT slides.
If you like the slides above, you can download the package we designed (or subscribe and get slides every month for your needs).
Should you need help with choosing or using our PowerPoint graphics, let us know here. We will gladly assist you.