Last Updated on November 30, 2022 by
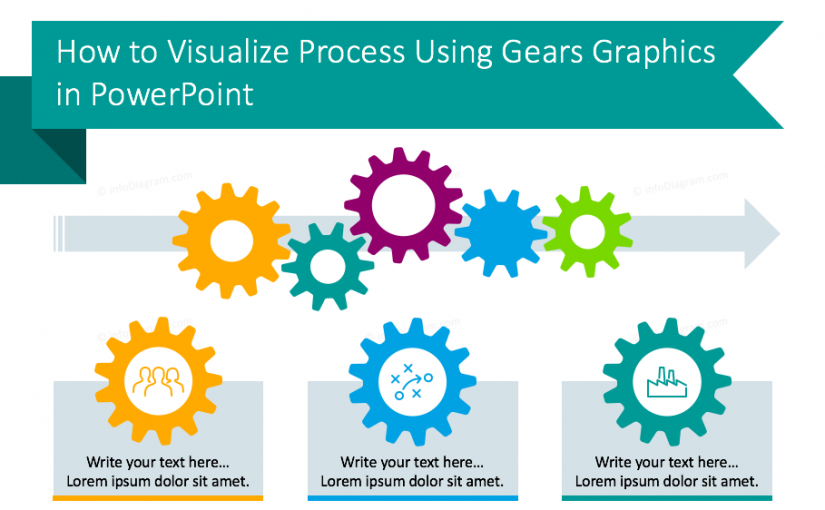
Do you want to present a process flow on a slide in a creative visual way? We collected a few slide design ideas with gears graphics, that you can use to show a flow of interlinked stages.
Making an informative and at the same time, elegant slide can be difficult. We advise avoiding long sentences and choosing easy-to-grasp graphics that will illustrate your processes. A good way to present related elements and operations is by using gears graphics.
Remark: You can get all the diagrams and icons from the Process Gears & Cogs PPT Template.
Why Use Gears Diagrams in Your Presentation?
The concept of turning and rotating gears is easy to understand visually. They can serve as a good metaphor not only for the technical audience. These graphic elements can help you to make a common view of your management flows and business dependencies explanations.
As the result, the presentation will get a dynamic and visually appealing look.
Below you can see a few areas where using gears graphics makes very good sense:
- Visualizing the sequencing process of elements that are directly related, moving each other
- Timeline of strongly interlinked events
- Illustrating engineering or mechanics topics
- Creating interesting roadmap plan graphics with cogs at each roadmap turn, adding a dynamic effect
- Replacing bullet-point list by gears enumeration text fields
- Comparing somehow joint items that are connected together by a central gear
Here are specific slide visualization examples of those areas:
1. Gears Graphics Instead Ordinary Bullet Points
Using bullet points in a slide is very common. It’s fast to write but it looks pretty ordinary. If your points represent interrelated items, consider adding a set of wheels moving each other.
Below you can see an example of how to replace such a bulleted list layout with a more creative one. With the help of gear symbols, you can show the synergy between list elements of the process. Text description aside from the graphics gives you space to add detailed item information if needed.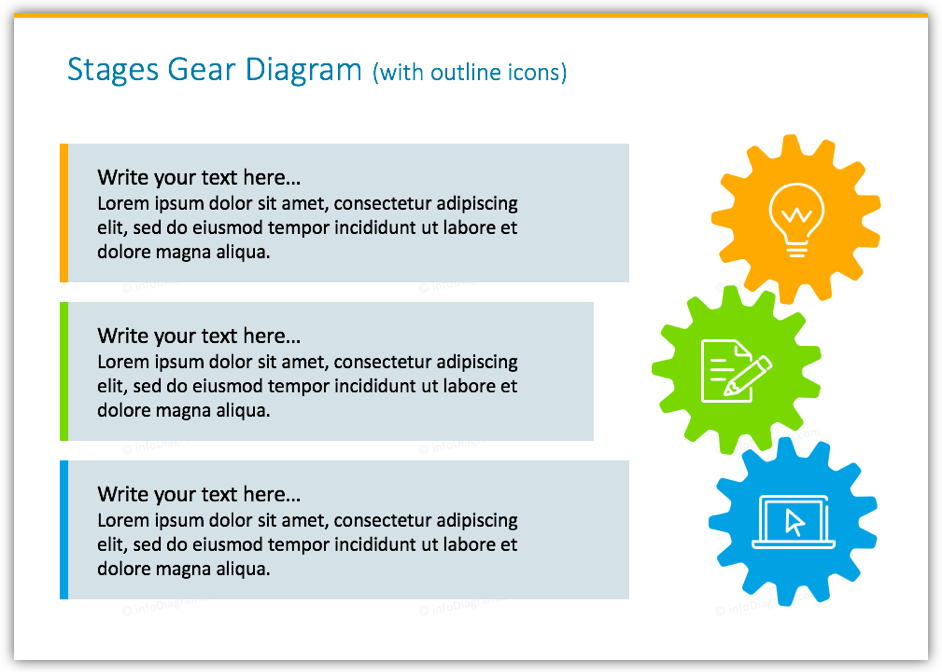
2. Vertical Gear Set Timeline
The timeline is a typical graphical tool for illustrating plans and steps in chronological order. Using a set of cogs will help you to show the logical connection between timeline events.
We suggest you use bright colors and flat-style graphics but you can recolor them to more decent colors, too.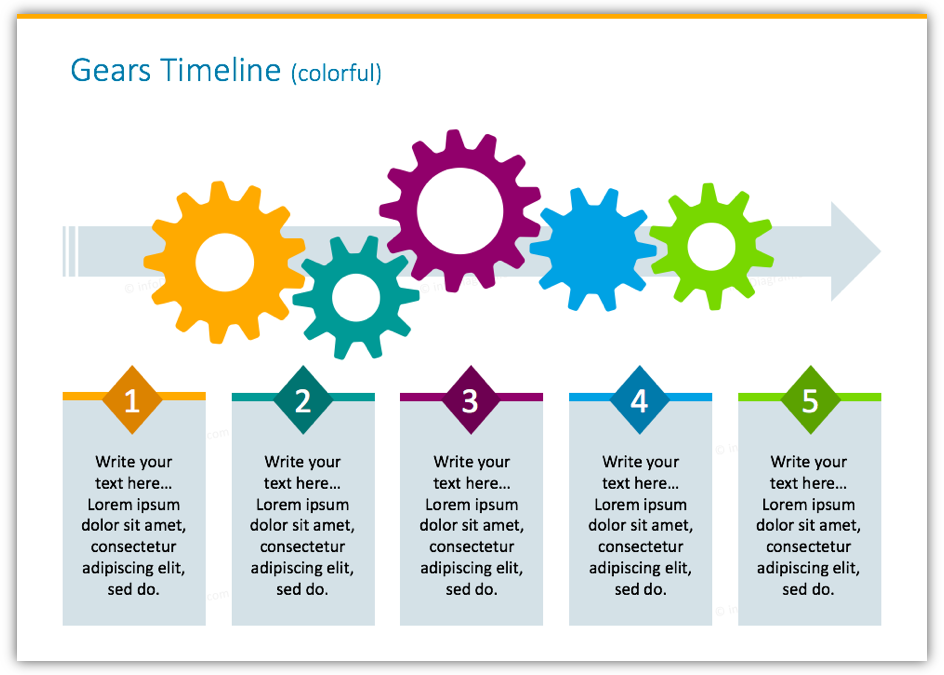
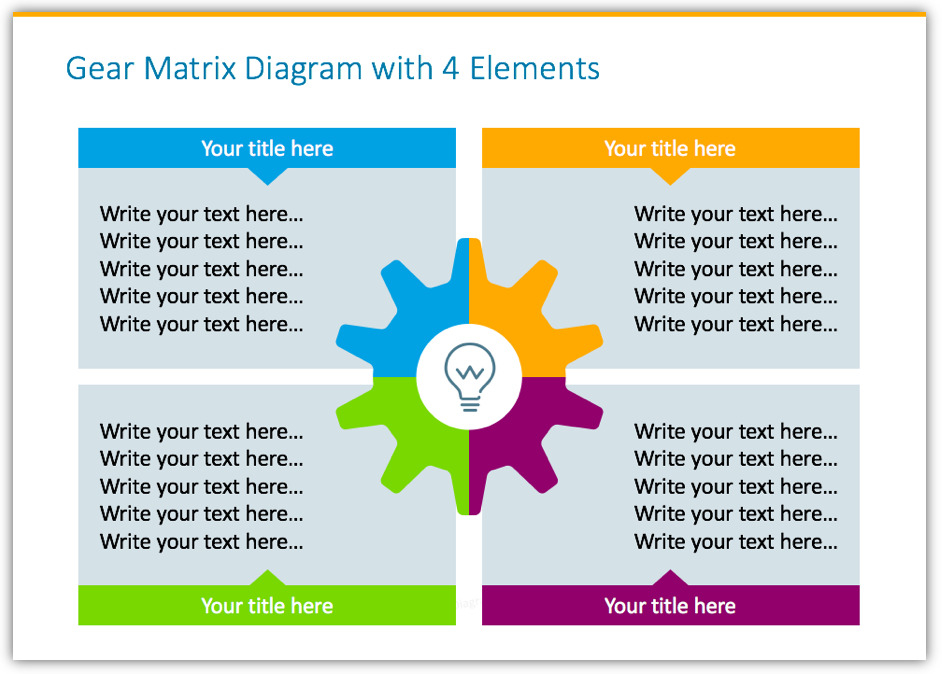
3. Presenting Matrix Boxes with Central Gear Image
If you have a slide with a set of elements organized in some kind of matrix, you can use a gear image as a central element. A good example from management analysis is the SWOT matrix.
Below we prepared an example of a general four elements matrix that can serve you as a basic template for your business models, SWOT, or any comparing analysis.
4. Loop Chain Process Diagram with Gears Graphics
Gears graphics can also serve you for illustrating a cyclic process. We created an example of the loop chain operations diagram.
Thanks to cogs icons this slide template will help you to express dynamic acts of the cycle.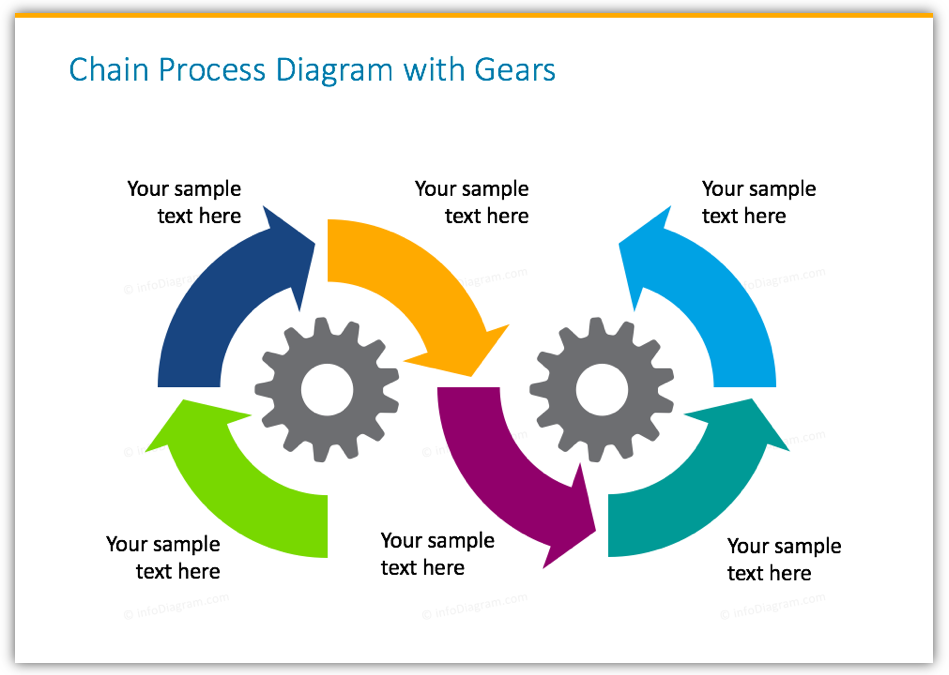
Those were some universal examples, where cogs and gears images are used not only as an engineering or mechanics topic illustration.
Colorful gears graphics are easy-to-grasp graphics that will help you to express various process stages to your audience. You can reuse one of those examples we designed (check resources below) or create your own set based on the presented layouts.
Resources: Process Gears and Cogs PowerPoint Template
To help you present interlinked processes and directly dependent items in a presentation, we have created a set of editable Process Gears and Cogs PPT Graphics. This diagram collection includes 17 gears diagrams for timeline and sequence listings, 13 gears diagrams for illustrating stages process, and 9 outline icons set.
If you like the slide examples above, you can check and download the slides directly here:
If you want to get more graphics for your presentation, check the wider Flat Icons Library with over 380 creative symbols.