Last Updated on September 19, 2023 by Anastasia
Presenting market research reports or market analysis? You can help your audience understand who your target group is, what the market size looks like, and what the trends are in your competitive market landscape.
Whether you need your audience to understand what the marketing scope is, what its potential is, who your competitors are or other details – the market analysis diagrams set can help.
Note: All example slides below are accessible in Market Analysis PPT Diagrams (see details by clicking the pictures).
What’s the typical content of a Market Analysis presentation?
Market analysis presentation content can vary, depending on the market you study (is it local, national, or global?) and the type of your business (services, products, B2B, Retail?).
Understanding and defining who is in your target market are often essential, as is considering what the competitive landscape looks like at the time you’re presenting.
Let’s have a look at typical topics present in the market research:
- Target Market Definition and its characteristics
- Presenting your ideal customer – a company profile if you are in a B2B business or sales avatar for all B2C and retail companies.
- Geographical scope presented by world or country maps
- Market Size & Potential estimation
- Market Trends & Drivers
- Market Evaluation, by one of the analysis frameworks e.g. SWOT, PESTLE, Porter’s Forces
- Competitive Landscape – comparison of main competitors, their pros and cons,
- Success Factors for market entrance
- Next Actions summary, to access the analyzed market.
How can you make those presentation sections more engaging or eye-catching? We suggest following those 4 rules:
- Declutter – Keep slide content clean, and avoid stuffing too many details. Spare them for the printed handouts.
- Ensure the presentation has a readable structure e.g. clearly separate sections
- Use modern and vivid visuals to pass the essential information
- Ensure graphical consistency, by using a limited color palette and graphical styles.
Let’s see some examples.
How Using Visual Diagrams will Make Complex or Abstract Concepts Resonate
1. Define Your Target Market, Market Size Section, or other Terms
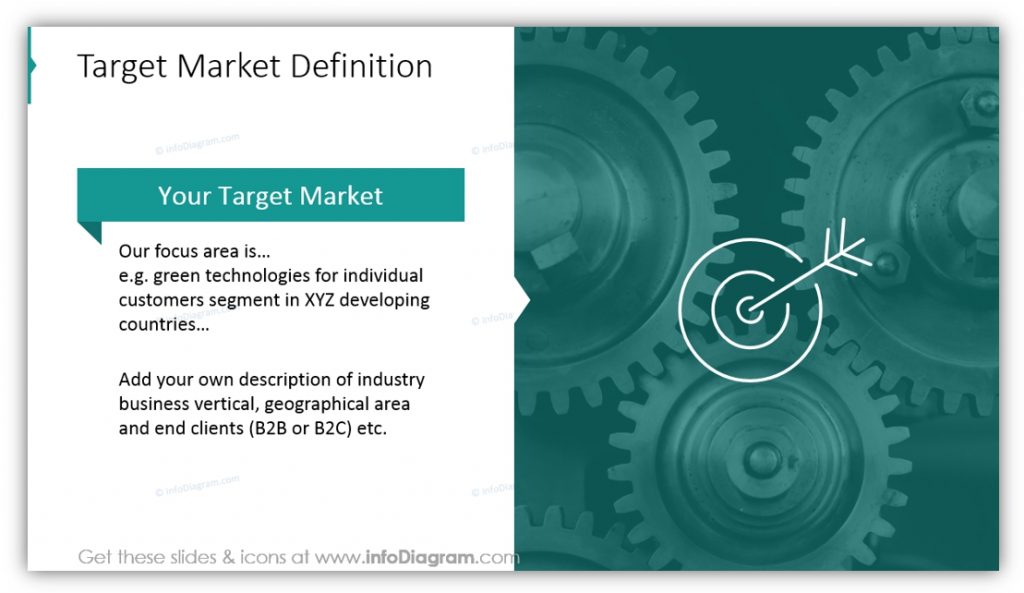
You should define who your target market is, and what your focus areas are. You should also describe and explain your market size. If you’re presenting to a group of novices, you may also want to define the terms you will be using throughout the presentation. This will help them follow along and ensure they’re on the same page as you progress to more complicated material.
2. Provide a Target Client Company or Persona Profile Card
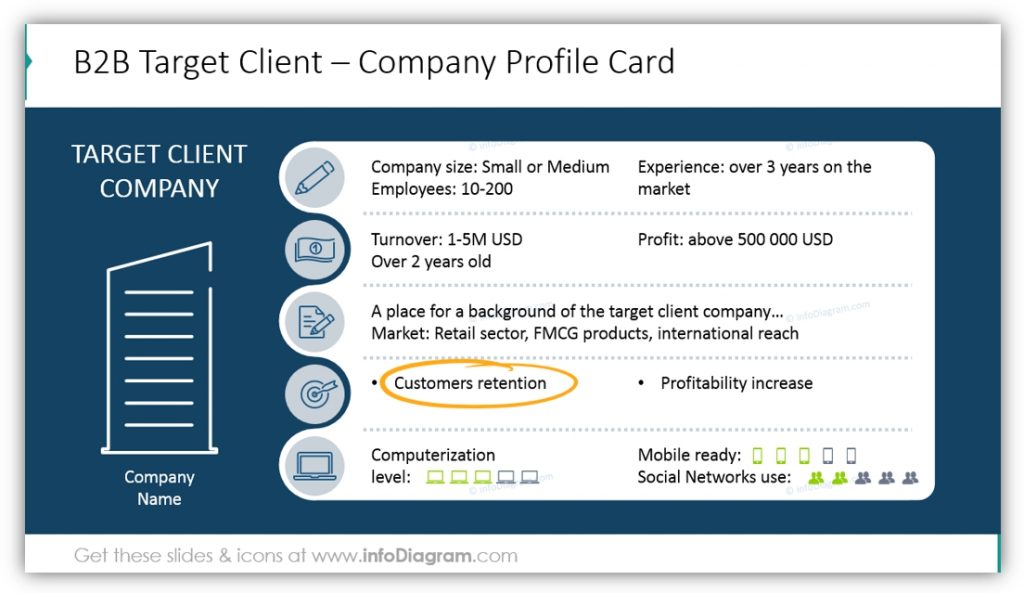
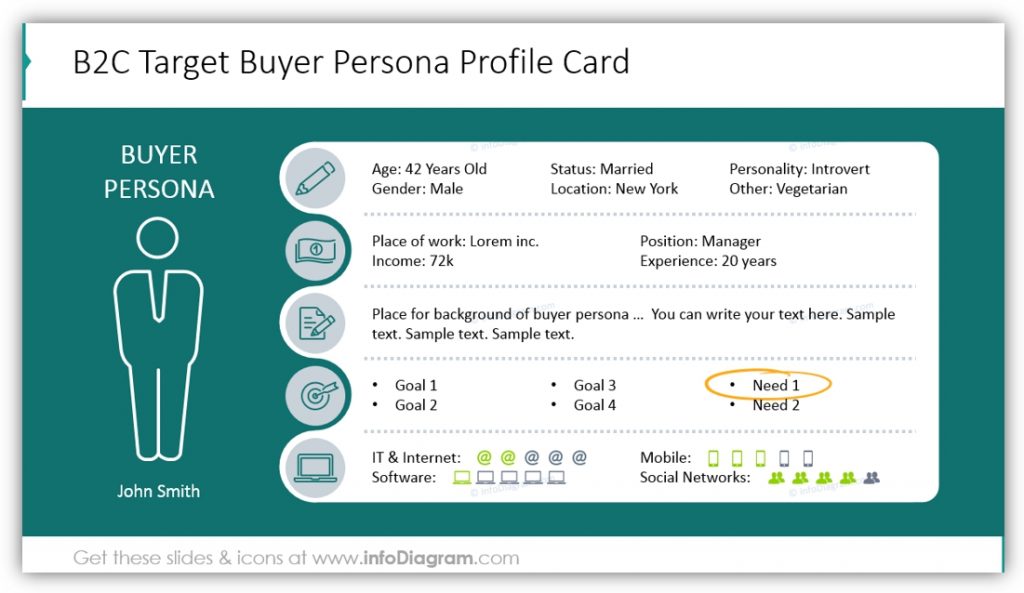
Explaining who your ideal clients are is infinitely easier when you can show your audience just what you mean. You can modify the text on this slide to match whatever it is that your ideal client looks like in terms of industry, experience, and even more. By changing the icons you can focus the profile card on whatever aspects of your target client are important to your business or the audience you’re presenting to. Notice how you can also use icons to circle significant data or change the color of the essential details.
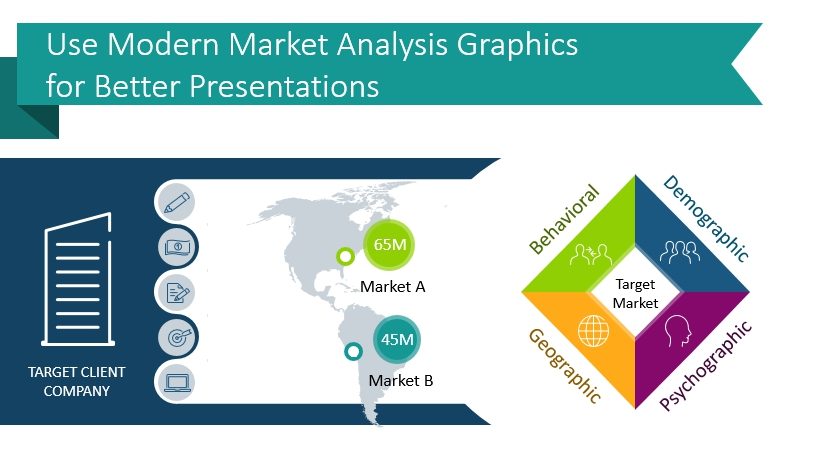
3. Explain Your Market on a Global Scale
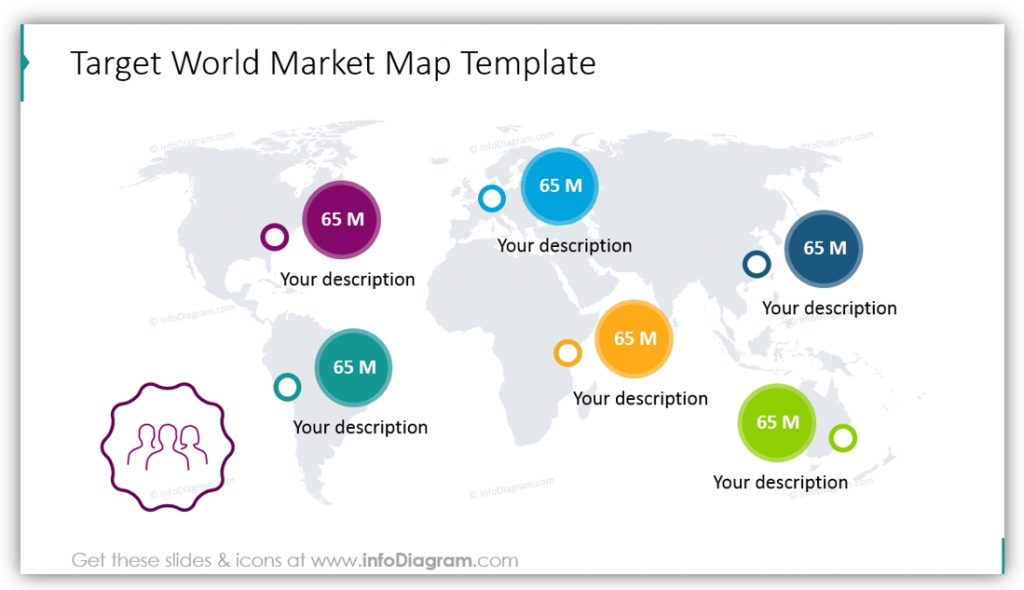
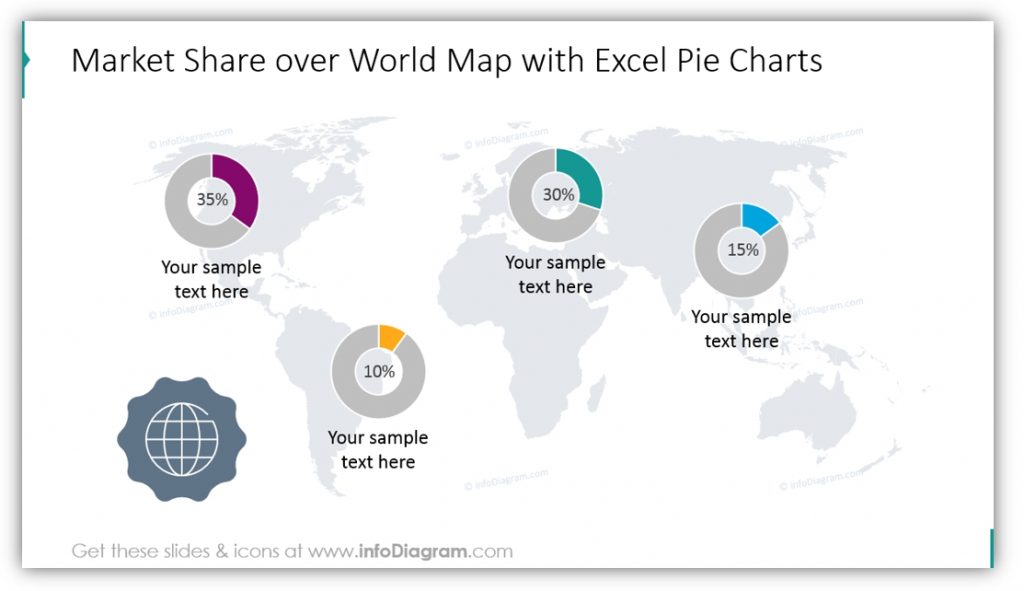
Do you do international business, or would you like to? You can show the folks you’re presenting to what your current audience looks like, or what your audience should be based on population and demographic information. You can customize the colors or add supplemental text descriptions to provide additional context and explanation for your audience.
4. Describe Market Characteristics
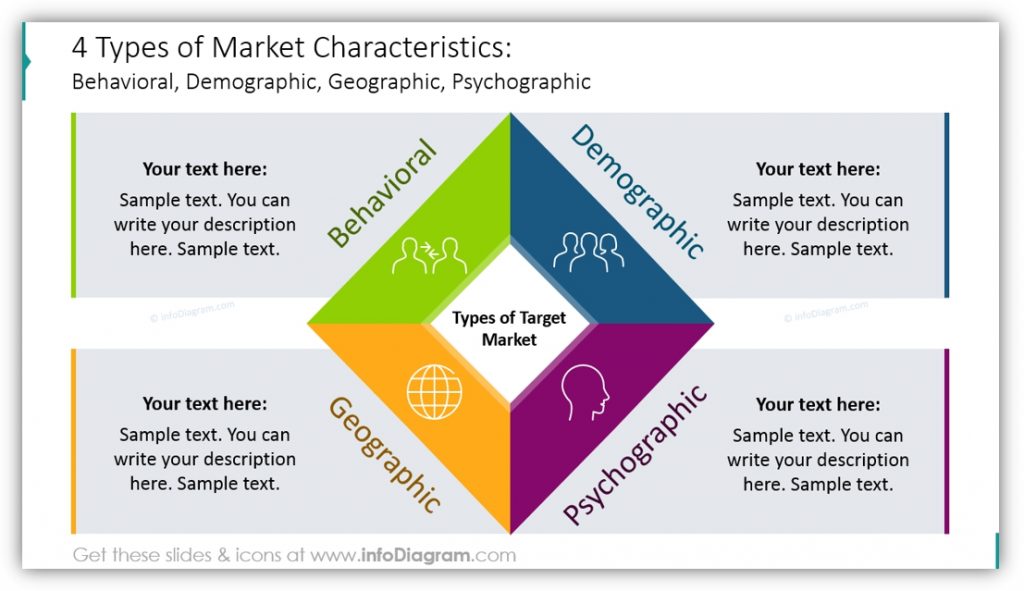
Market characteristics aren’t all demographic or geographic. By using this slide you can highlight the behavioral and psychographic aspects of your market. This will provide even more details for your target client profile or will help you provide the basis for your audience to build their own target client profiles.
5. Explain the Size of Your Marketing Areas
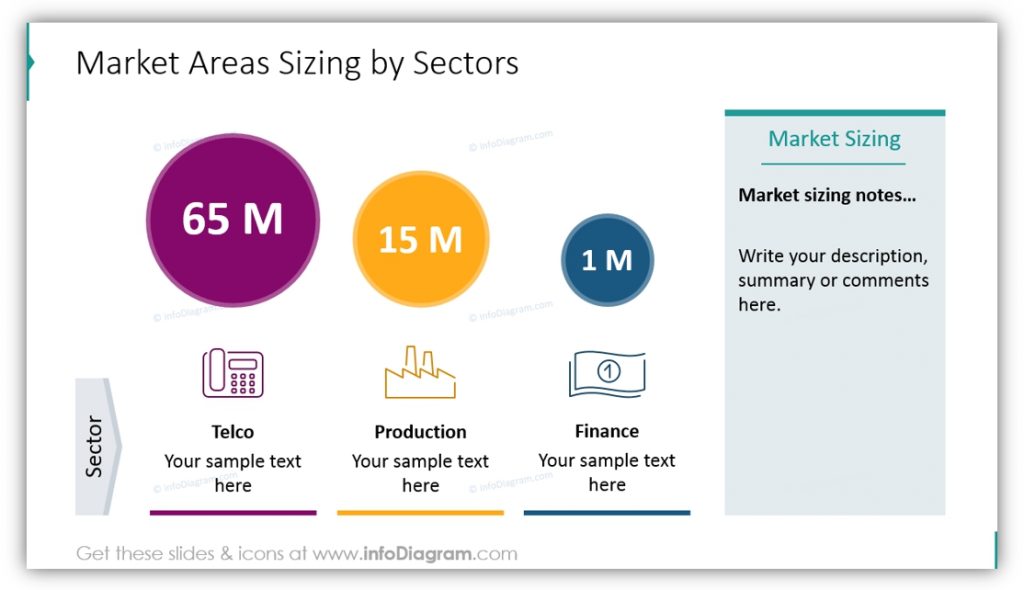
In the example, the market area sizing is explained and divided by sector. If you wanted to use this approach or modify it for your own purposes you could easily change the icons which represent each sector or divide your marketing areas by different variables or criteria. The text box at the side gives you an opportunity to offer more information or provide details about each sector.
With the help of icons, you can easily define your target market or market size section for your audience. You can provide those you’re presenting to with target client/persona profile cards, and explain your market on a global scale. You can also describe market characteristics and explain the size of your marketing areas, and these are just the uses we’ve thought of!
Resource: Market Analysis Presentation Diagrams
You should use visual charts on slides to help you illustrate market research information. Market research data can be complicated and difficult to make sense of for those who are unfamiliar with the topics; that’s why having icons and visual aids is useful. These icons are all fully editable in PowerPoint and don’t require any additional software or training. These are vector images that can easily be resized. In addition, you can change the colors of the icons’ outline and filling, add shadows, rotate or flip the objects you’re using, or even layer them differently on the slide.
If you find the above examples useful or helpful you can down the full diagrams set here:
Market Analysis Presentation Diagrams
Looking for more marketing templates? See our Business&Marketing slide decks collection.