Financial Reporting PowerPoint Bundles
Working on financial reports? Using only Excel tables is not very engaging. Try presenting financial results using a stronger visual format.
Check the PowerPoint templates, click on specific slide-deck picture to explore its content. To save 10% buy any of those separately or in a bundle.
Use this Promo Code in the order form to get a discounted price: 10-EndYear2026
19 charts & diagrams, 51 icons
$45
22 charts & diagrams, 78 icons
$61
16 charts & diagrams, 56 icons
$54
19 charts & diagrams, 46 icons
$52
4 Decks, 109 Slides
Total value with discount:$212 $191
Use this Promo Code in the order form to get a discounted price: 10-EndYear2026
35 charts & diagrams, 77 icons
$75
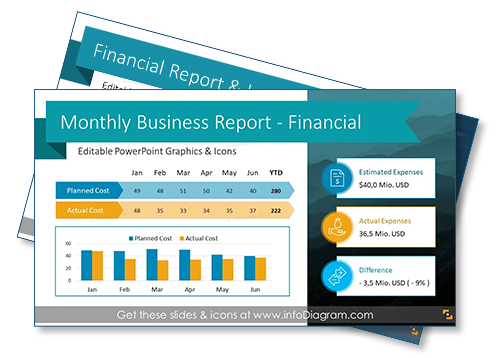
38 charts & diagrams, 72 icons
$74

33 charts & diagrams, 50 icons
$58
30 charts & diagrams, 83 icons
$80

4 Decks, 179 Slides
Total value:$292 $262
Use this Promo Code in the order form to get a discounted price: 10-EndYear2026
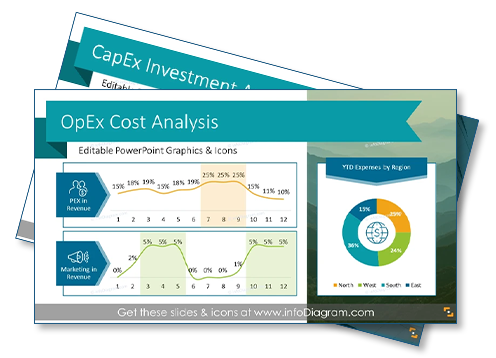
33 charts & diagrams, 51 icons
$54
16 charts & diagrams, 39 icons
$36
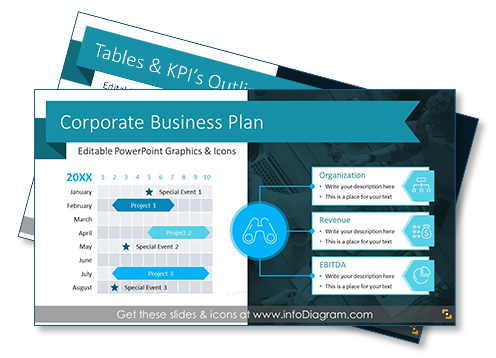
31 charts & diagrams, 45 icons
$54
26 tables & diagrams, 65 icons
$39
4 Decks, 144 Slides
Total value:$183 $165
Use this Promo Code in the order form to get a discounted price: 10-EndYear2026

Summary of bundle purchase options:
Bundle 1
4 Decks, 109 Slides
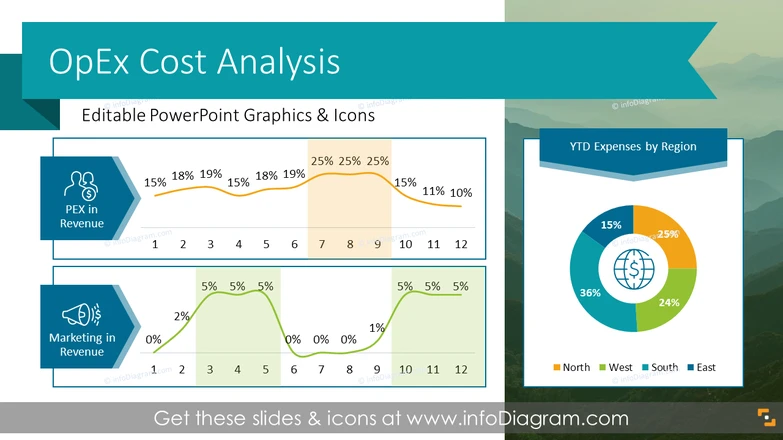
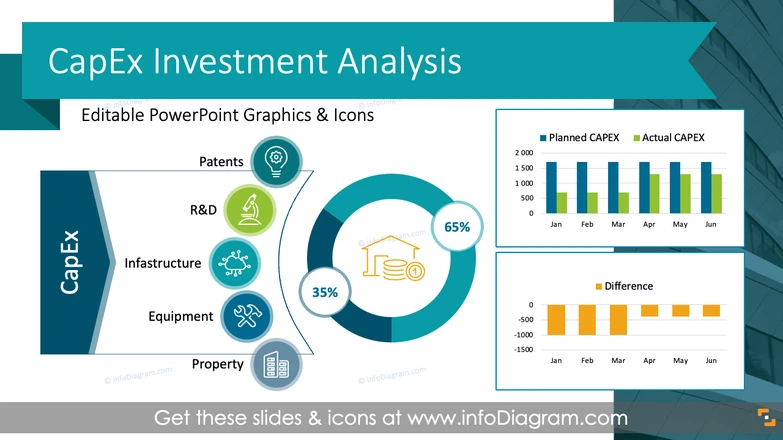
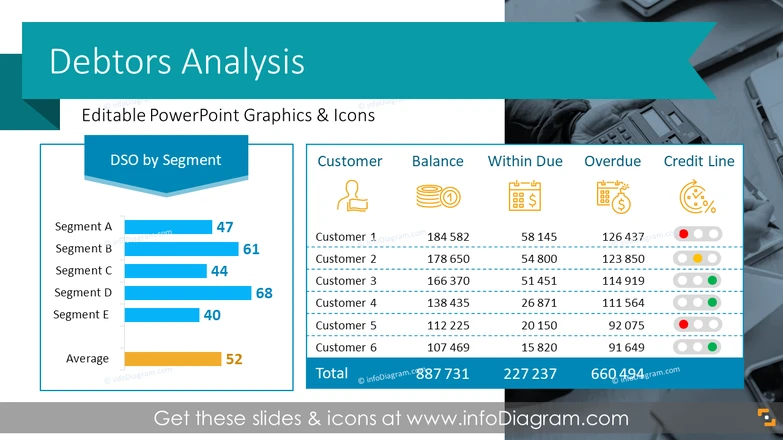
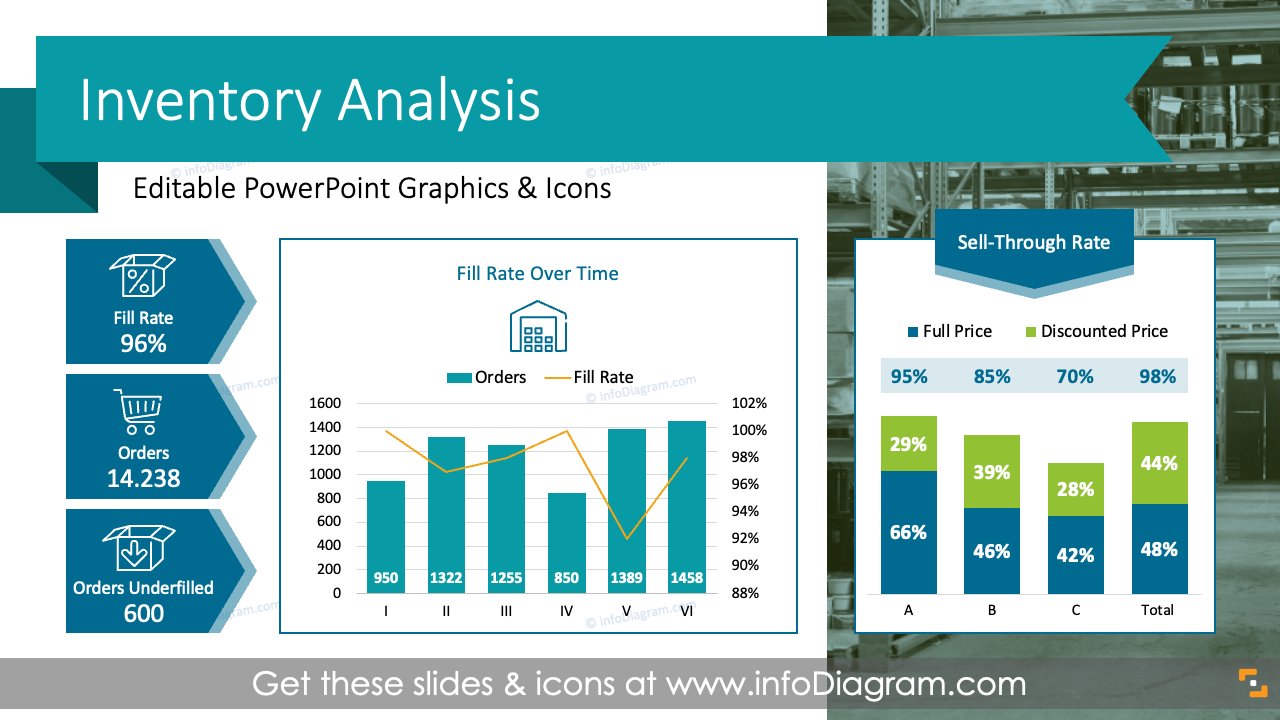
Financial Liquidity
OPEX, CAPEX,
DEBTORS, INVENTORY
Value: $212 $191
Bundle 2
4 Decks, 179 Slides
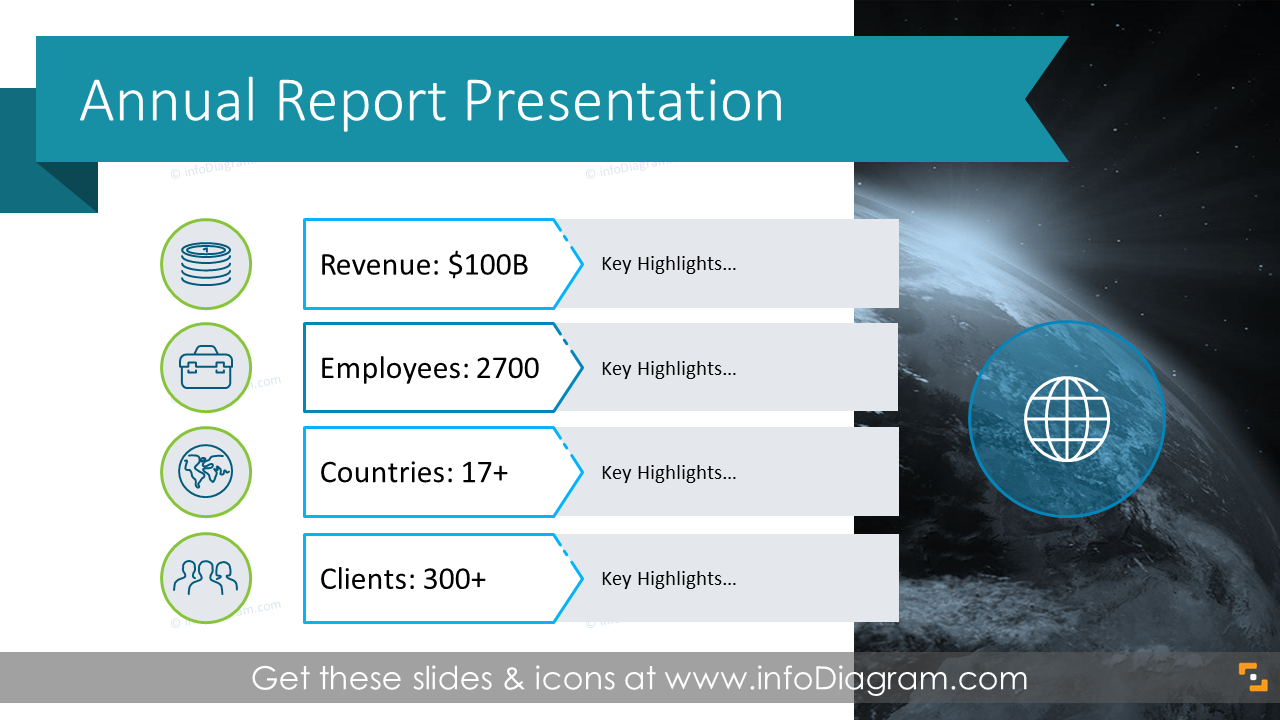
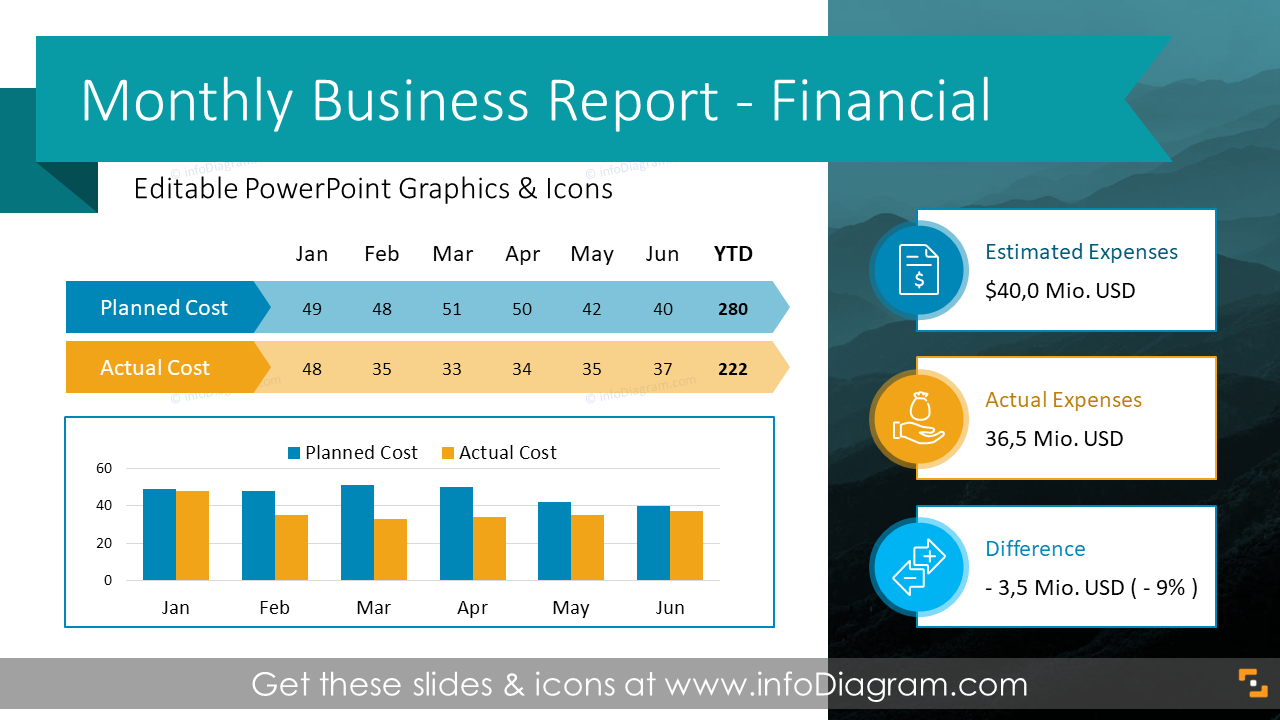
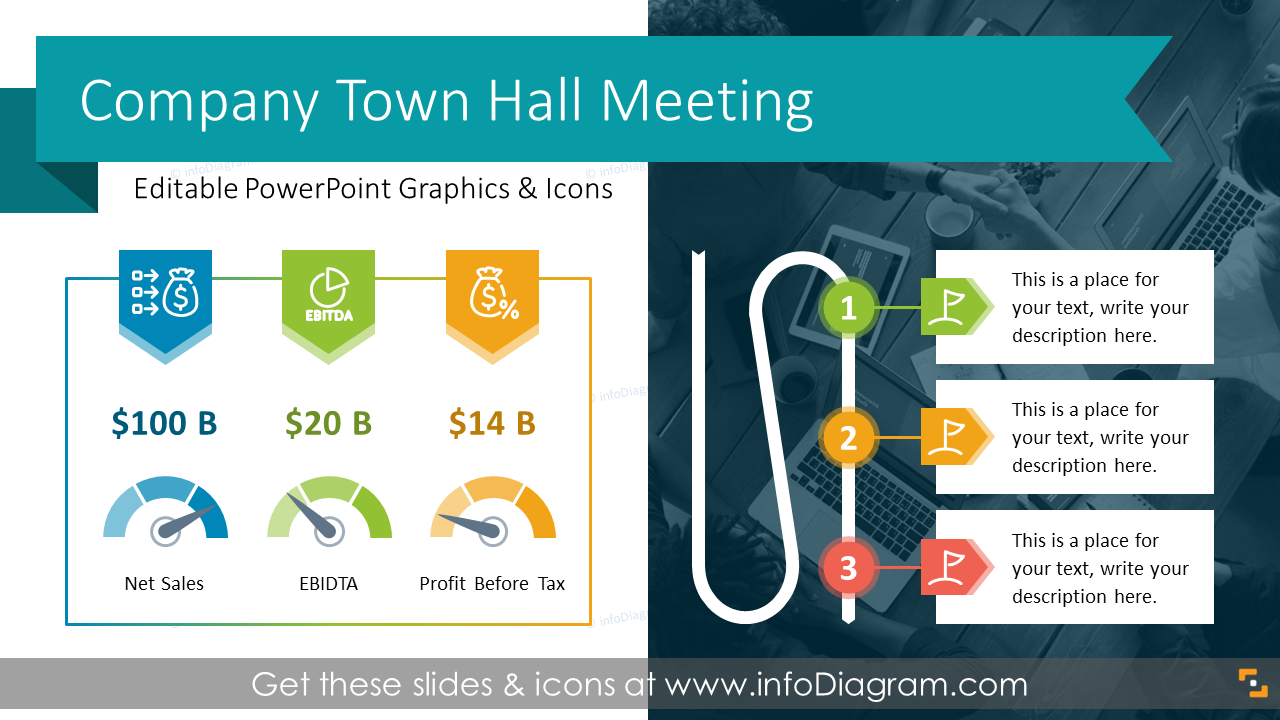
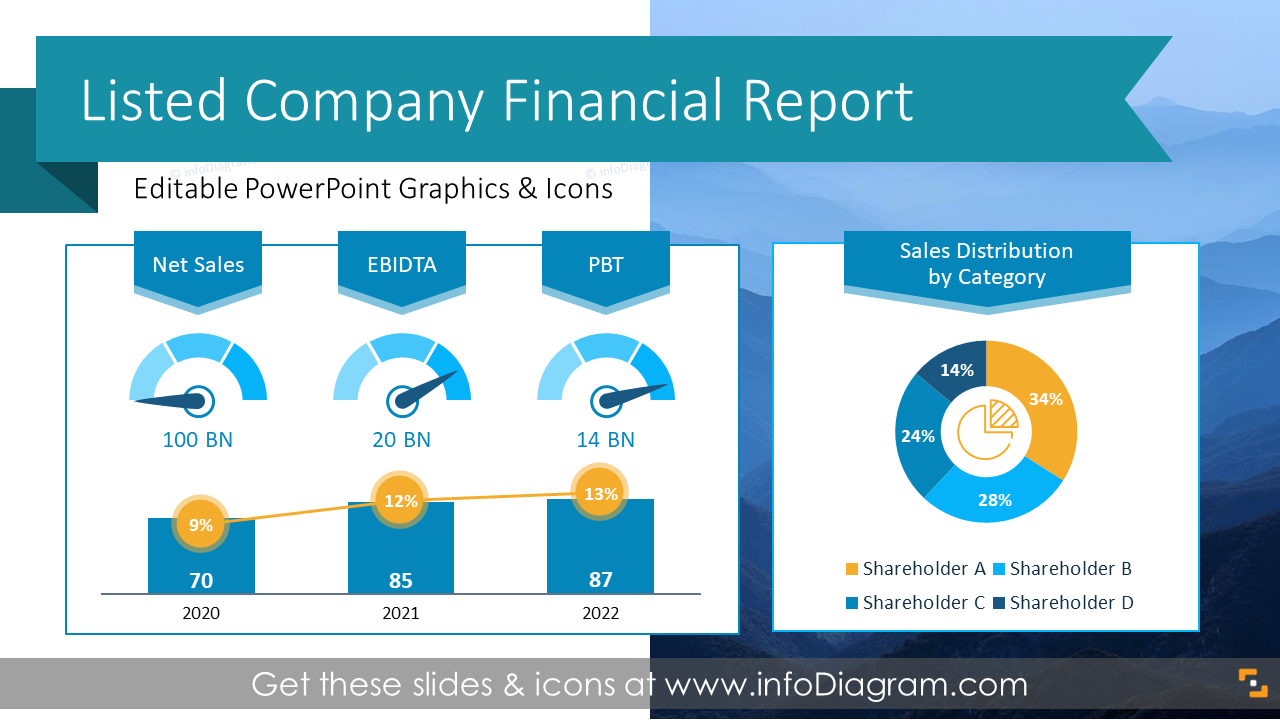
Financial Reporting & Planning
ANNUAL REPORT, BUDGET, MBR, METRICS
Value: $292 $262
Bundle 3
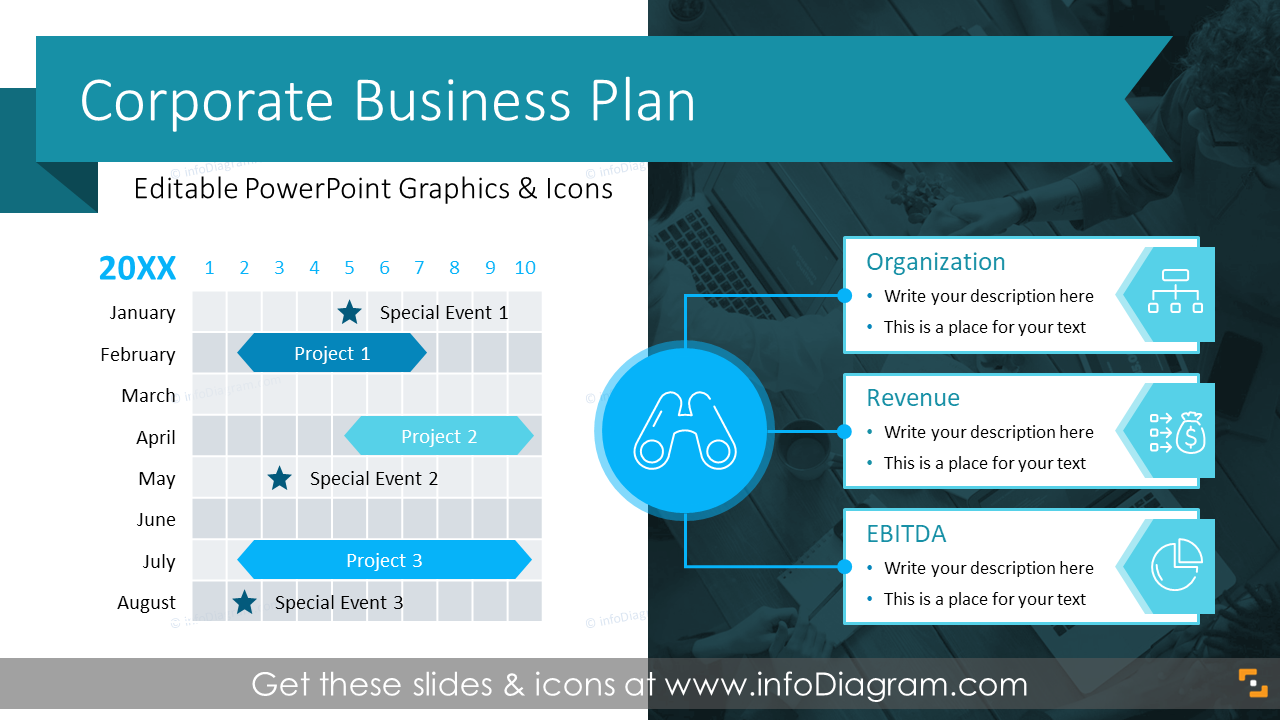
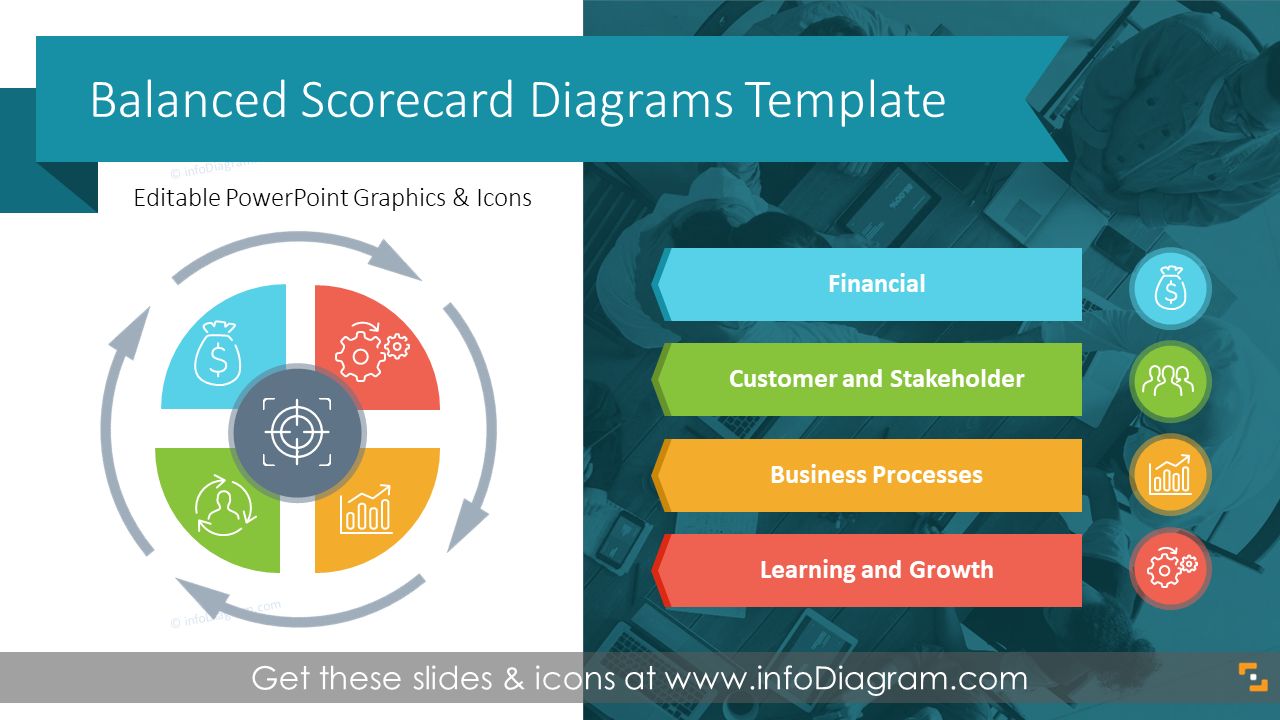
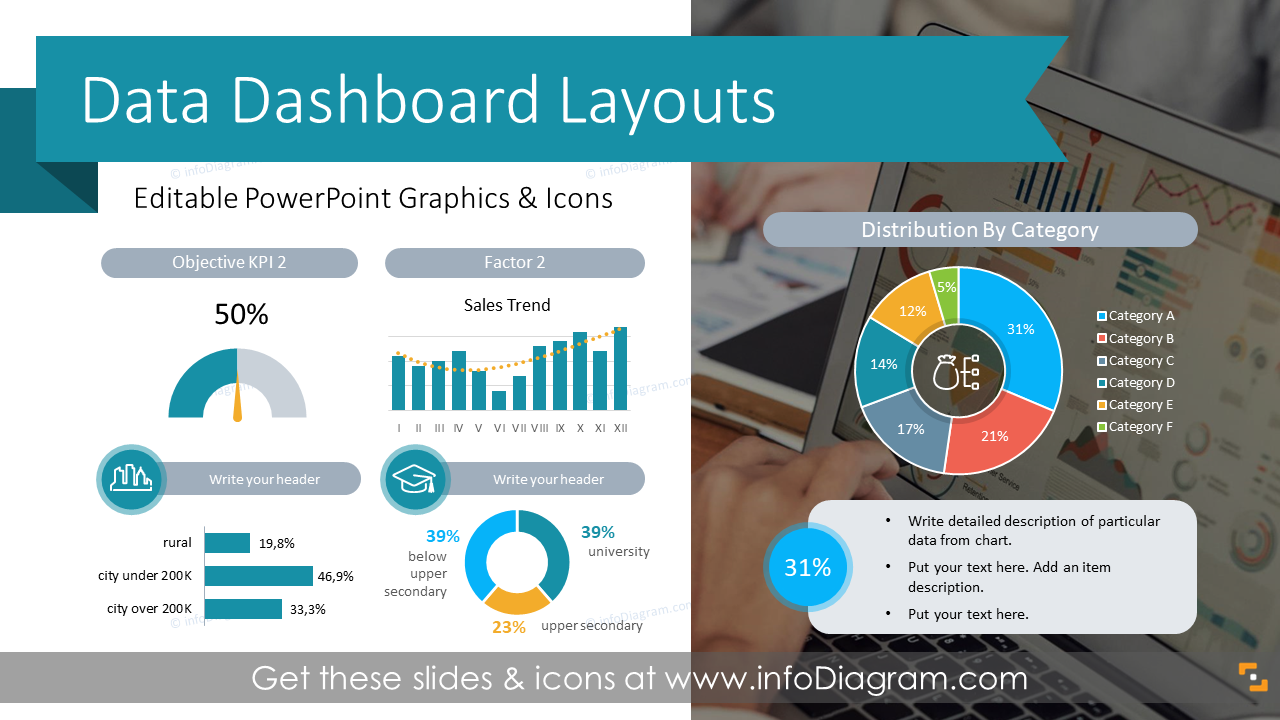
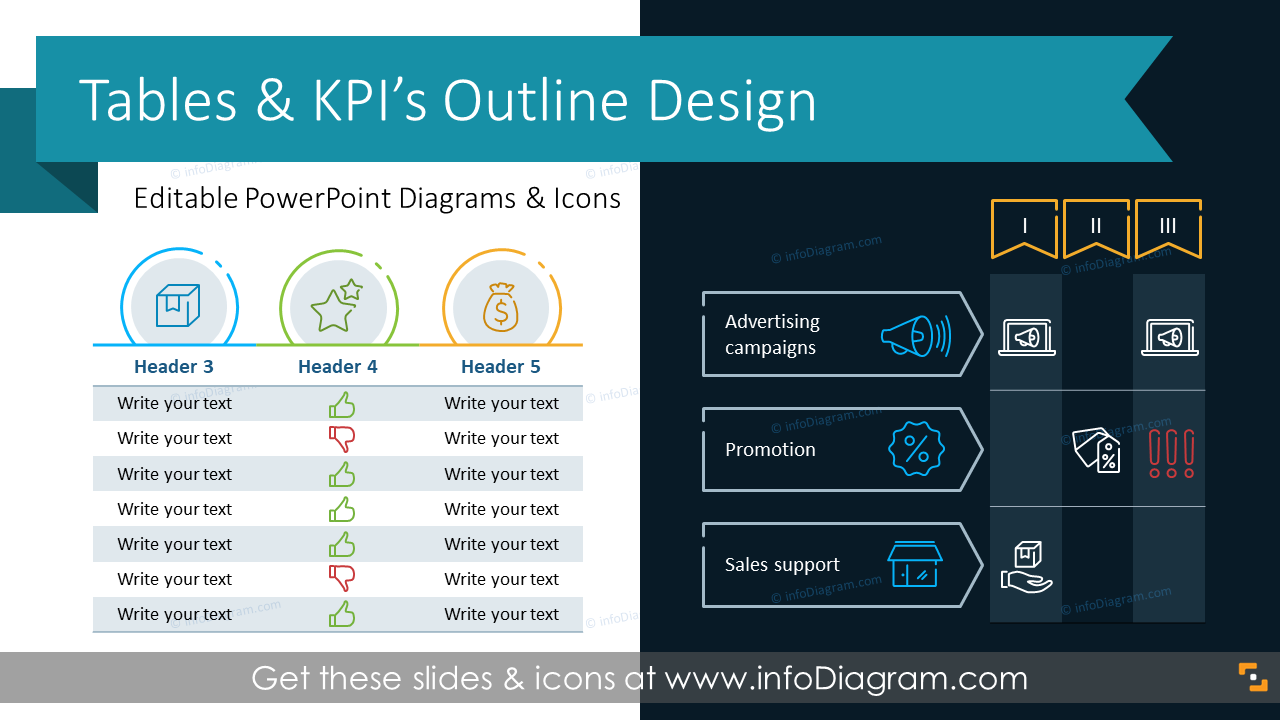
4 Decks, 144 Slides
Supportive Financial Reporting
PLAN, SCORECARD, DATA DASHBOARDS, KPIs
Value: $183 $165
Easy-to-adapt PowerPoint templates
- decks contain data charts based on Excel sheets where you add your financial data and adapt business KPIs, trends, categories, etc.
- when you copy the PowerPoint slides to your company template, the branding color scheme will adapt to your business’s palette.
- every deck includes a collection of financial icons in one consistent style to illustrate business finance terms (earnings, expenses, EBIT, profit, tax, debt, etc), to help you explain complex topics attractively and professionally.
Free sample of financial slides
Want to try before you buy? We get you. Check our free sample deck with financial slides here.
Learn more – articles, videos
Explore our blog articles on presenting financial topics:
Or check video serie of financial slides makeovers on YouTube channel infoDiagram Creative presentations
Any questions? We’ll be happy to answer them. Contact us here.