Best Practices for Financial Excellence of a Company
Why a company with high sales and margins might still face turbulences? I’d like to present a few financial success tips and insights for a company’s effective financial performance.
These insights are based on my experience as managing director of international brands companies. I am aware how important presenting financial data with clarity is, especially if you presentation is addressed also to non-finance people.
The company’s healthy cash flow secrets are not only addressed to the CFO. They are important for those in the organization who make operational decisions that freeze the company’s financial resources.
Is it possible to go bankrupt while achieving good financial performance KPIs – high sales and gross margins?
This might seem counterintuitive, but several factors can contribute to this situation.
High turnover and gross margins achieved do not necessarily mean healthy cash flow. Of course, high sales are typically a positive indicator but they do not guarantee financial success. Effective cash flow management, cost control, managing debt, and overall financial discipline are crucial to ensure that high sales translate into sustainable profitability and financial stability.
Financial Managers pay close attention to where the company’s resources are tied up, for example
- outstanding invoices,
- overstocking,
- unsustainable expenses, etc.
Finance Controllers not only strictly monitor cost-related elements, but also very often have to explain discrepancies vs. budget or last year and prepare the so-called contingency (often cost-cutting) plans.
Here are some key reasons why a company’s financial performance measures – such as high sales and margins might still face turbulences.
1. High Operating Costs (OPEX)
Operating expenses are the ongoing costs associated with running a business, such as rent, utilities, salaries, marketing, and maintenance. When these costs are disproportionately high relative to the revenue generated, it can erode profits and lead to cash flow issues.
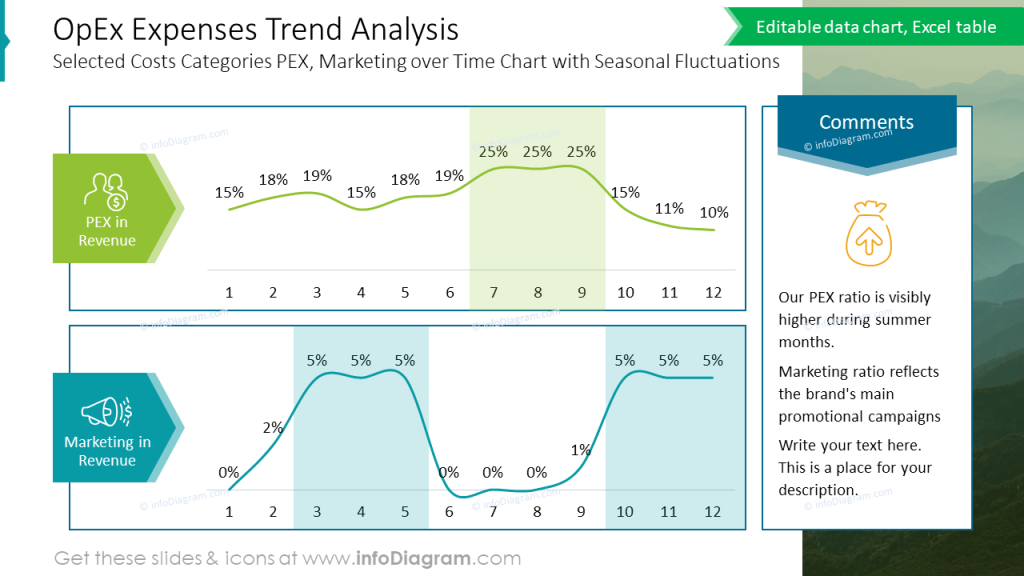
Conducting a detailed and ongoing expense analysis is the first step to respond to too high costs generated by the business. Each business unit should break down operating expenses into specific categories and compare current expenses with historical data to identify trends and overspending patterns.
In the example below, you can observe 12 months of fluctuations of 2 specific cost categories – personnel expenses and marketing investment as a percentage of the company’s turnover.
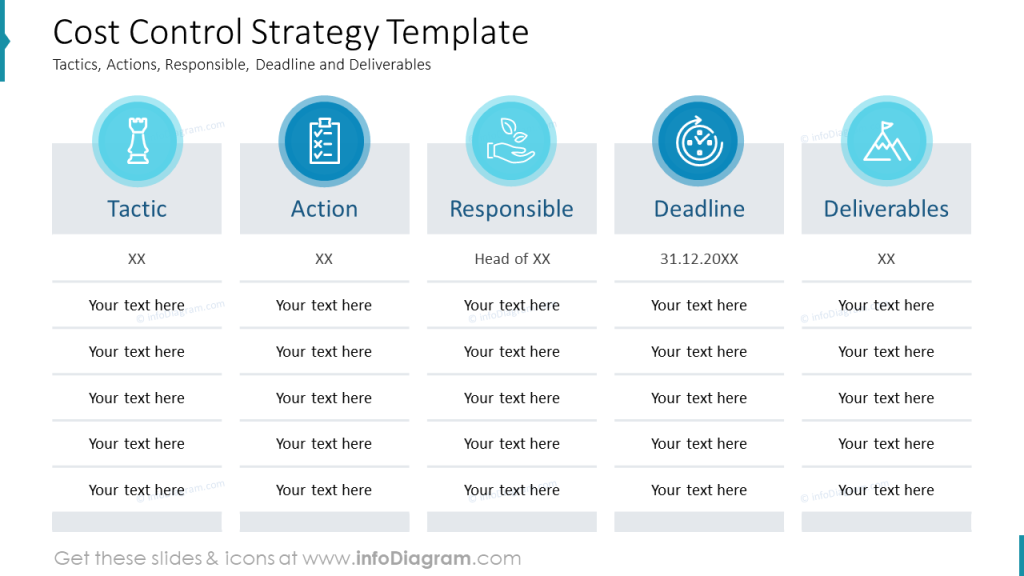
Costs analysis is however only the beginning. Implementing cost control measures with well-described objectives, strategies, and tactics aimed at minimizing expenses ensures a controlled and effective reduction of OPEX. A nice diagram, like the one presented below, can help you visualize your cost control strategy in an attractive and eye-catching format.
High Days Sales Outstanding (DSO)
Days Sales Outstanding is a critical metric that measures the average number of days it takes a company to collect payment after a sale has been made. A high DSO indicates that a company is taking longer to collect its receivables, which can lead to cash flow problems even if sales are strong.
Managing and reducing high DSO is crucial for maintaining healthy cash flow and financial stability. Each company should regularly monitor and analyze accounts receivables to identify trends and areas for improvement.
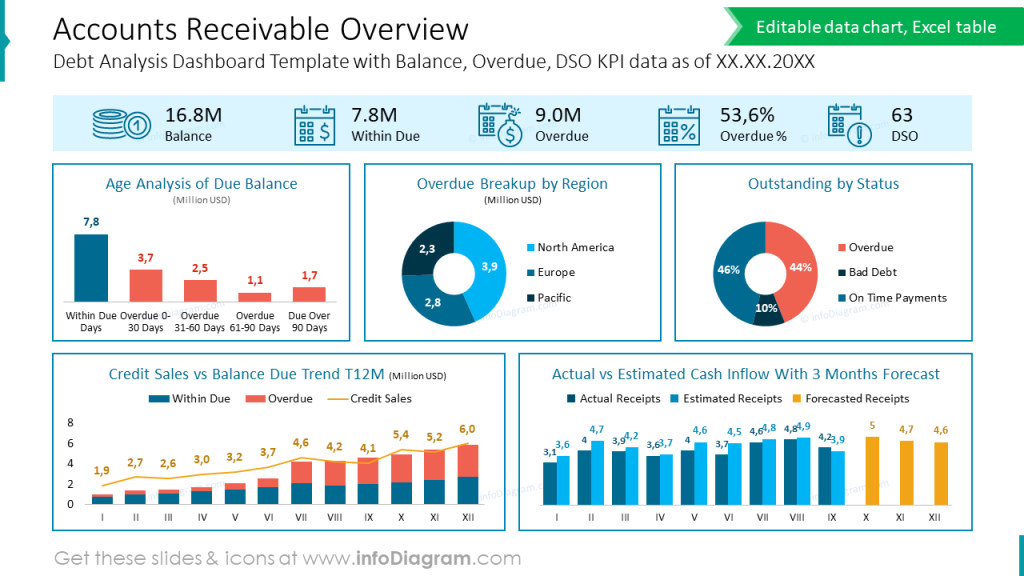
A/R Dashboard allows you to present your numbers in a compellingly, easy to understand by your audience. See example below how such dashboard can look like, where you see the detailed split of due amounts
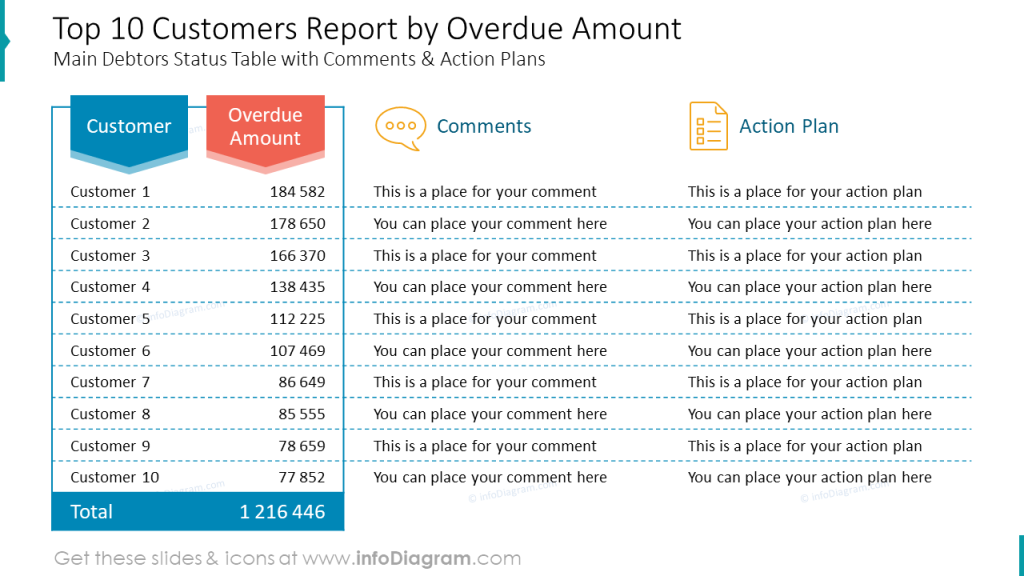
It is highly recommended to follow the payments of the customers to be able to proactively, well in advance, spot possible overdue invoices. Effectively managing debtors involves a combination of clear policies, efficient invoicing, proactive collections, and strong customer relationships.
It is worth considering an individual approach to customers, debts may result from various reasons, so it is good to prepare individual action plans for each of the debtors. Creating an appealing table can help visualize your top 10 customers by the overdue amount and adding some specific comments and blueprints makes it feasible to execute the debt collection.
High Days Inventory Outstanding (DIO)
The company’s money can also be tied up in stocks. Faster inventory turnover means the company can convert its products on stock into cash more quickly, improving liquidity. Particularly dangerous is the overstocking of hard-to-sell products that become obsolete at some point and which the company needs to write off.
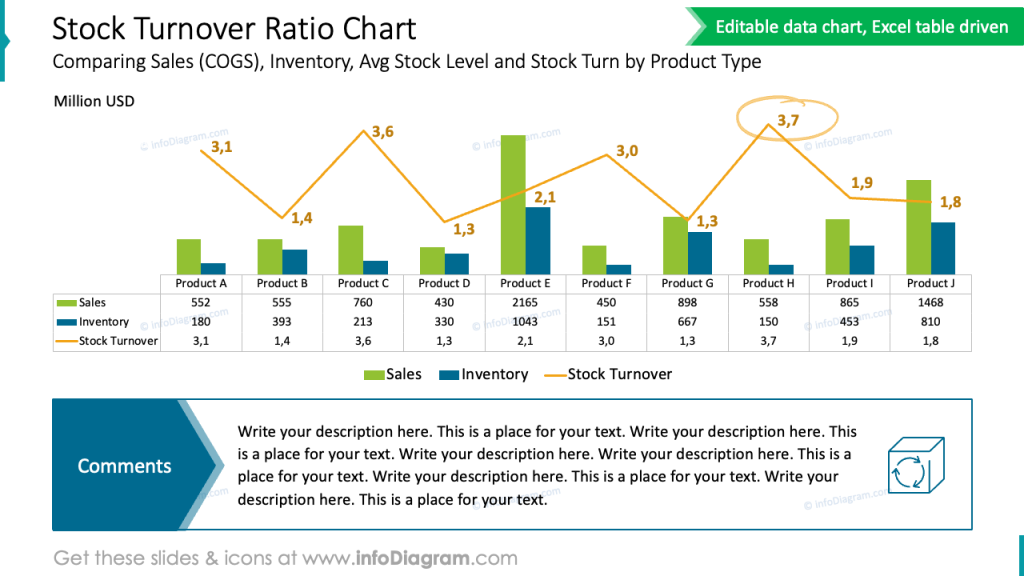
The Days on Hand (DOH) ratio, also known as Days Inventory Outstanding (DIO) measures the average number of days a company takes to sell its inventory. A low DOH indicates that a company is quickly selling its inventory, which is generally a sign of efficient inventory management. For most industries, the ideal inventory turnover ratio will be between 5 and 10, meaning the company sells and restocks inventory roughly every one to two months.
In the chart example below, you can find a combination of 3 elements – your sales, inventory levels, and stock turn ratio. I would recommend to highlight important data and/or include your observations in a comment box, which makes your analysis more understandable.
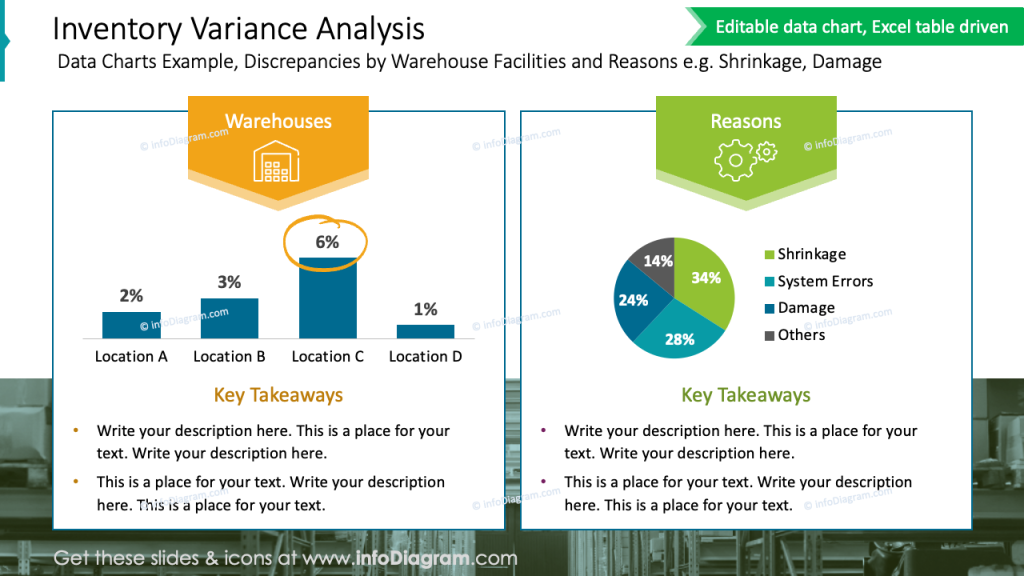
Lack of financial liquidity caused by low inventory turnover is not the only problem to worry about and analyze. It is also recommended to monitor carefully stock discrepancies. Inventory variances are gaps between the number of items a business has on hand and the number of items recorded in its inventory system. They can be caused by a variety of factors, including human mistakes, theft, damage, and system errors.
Proper visualization of the inventory variances, like in the presentation picture here, can be a powerful way to understand discrepancies in inventory levels, identify trends, and make data-driven decisions.
High Capital Expenditures (CAPEX)
Another element that can significantly freeze a company’s funds is investments done to acquire, upgrade, and maintain physical assets such as property, plants, buildings, technology, or equipment. High capex ratios are fine if the money spent is making high future returns.
Investing in growth opportunities, expanding operations, or acquiring valuable assets can be seen positively by investors, potentially leading to an increase in the stock price in the long term. Illustrating your decision process in clear steps can support the acceptance of your investment expenses, showing that you take a structural approach to CAPEX, taking into consideration CBA, risk assessment, and ROI.
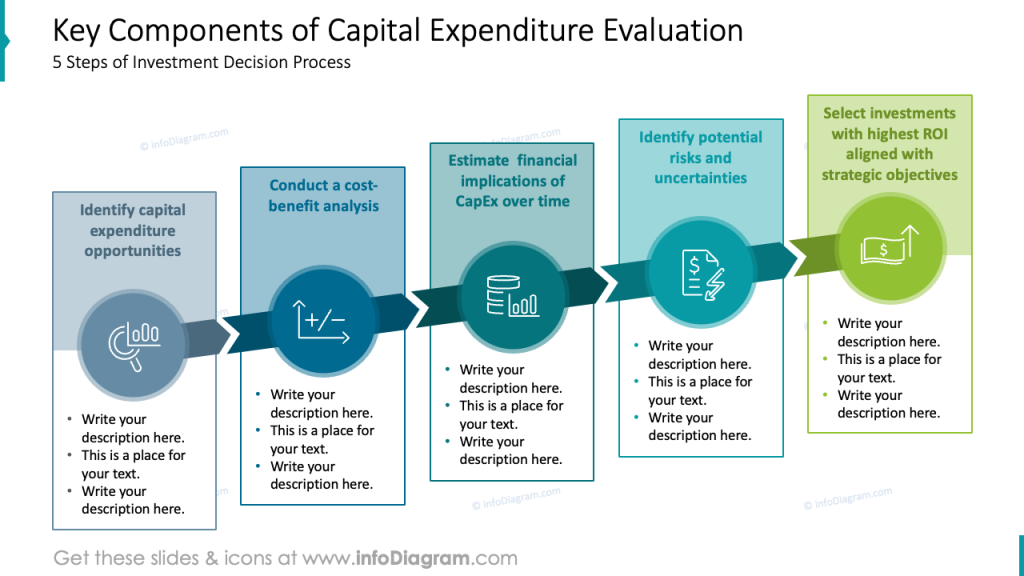
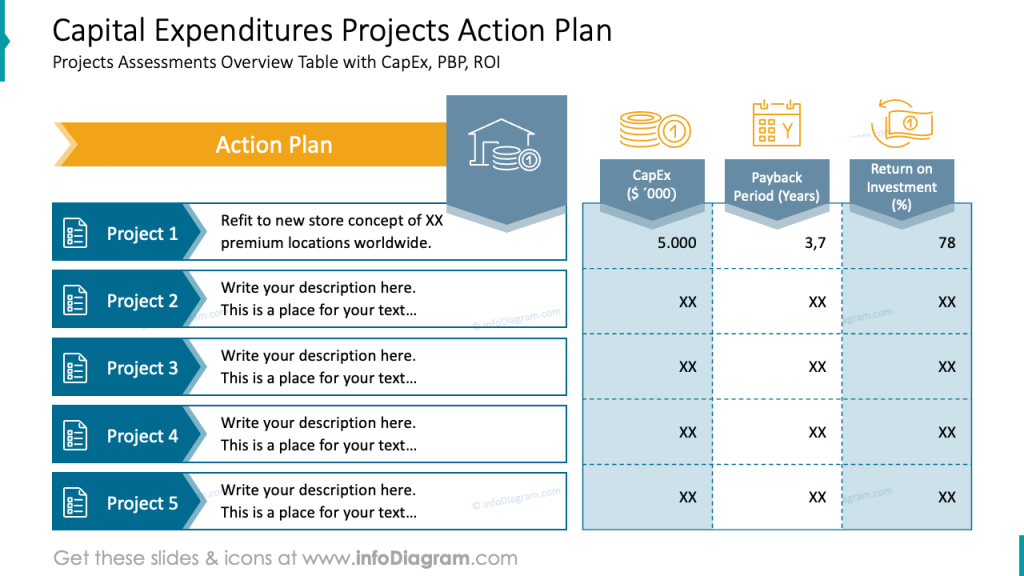
CAPEX needs to be carefully managed and justified with a clear strategic vision and realistic projections of returns. A company’s management should determine whether an investment is worth pursuing by comparing its total expected costs with its total expected benefits as well as forecasting the payback period and return on investment. You can assess each project using a table like this to present your business idea, CAPEX involved, PP, and ROI.
Key to healthy cashflow and company financial performance
To sum up, a company’s money can be tied up in various areas. Proper management of these areas is crucial for maintaining liquidity and ensuring that the company can meet its short-term obligations and invest in growth opportunities.
About author: Katarzyna Podleska
I have been working as a Managing Director for a couple of international companies from the retail industry. I know how important clear visualization of financial data is, especially for non-finance people in the organization. Monitoring OPEX, CAPEX, DSO, and DOH ratios is obviously a piece of cake for Financial Directors or Controllers but in fact, the level of those cost-related elements depends largely on people dedicated to the daily operations of the company (sales, marketing, logistics, etc.) Their business decisions have a huge impact on the company’s resources, profitability, and financial stability. That is why they must have access to easy-to-understand charts, diagrams, dashboards, or infographics instead of complex Excel tables produced traditionally by the finance department.
Reach out to me on LinkedIn, or book a consulting call on presenting and storytelling financial data.
Resources
To help you presenting financial results using an engaging visual format, we designed several templates you can get and use. For example:
You can get them as specific templates or as bundles for liquidity and financial planning reports.