Present Processes with Chevron Graphics
You can use chevron timeline diagrams to present your progress on a project or illustrate the steps of a list. Really, Chevron graphics can be used to represent any linear process. In recent years, Chevron has proven to be a modern and trendy design choice which will help your presentations resonate with your audience.
Chevron graphics can illustrate processes or lists horizontally or vertically. Whether you are listing a process or showing the passage of time, chevrons will suit the purpose.
All example images below can be found in collection Chevron Timeline Diagrams PPT Template (see details by clicking the pictures).
5 creative ways to present processes
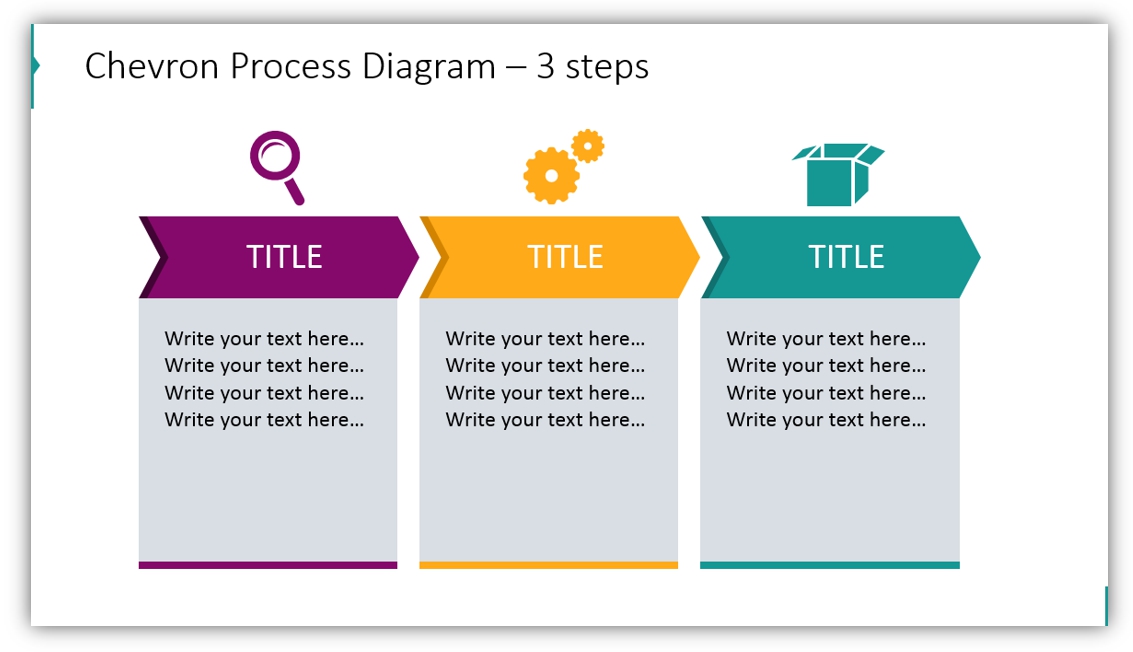
1. Show the steps in a process
Showing the researching, manufacturing, and production stages of a new product’s development are as easy as one, two, three with chevron graphics. By using simple icons as symbols you can clearly mark the different categories of steps. You can also create title bars with chevrons to plainly label steps and stages. By adding another column you can add another step to the process.
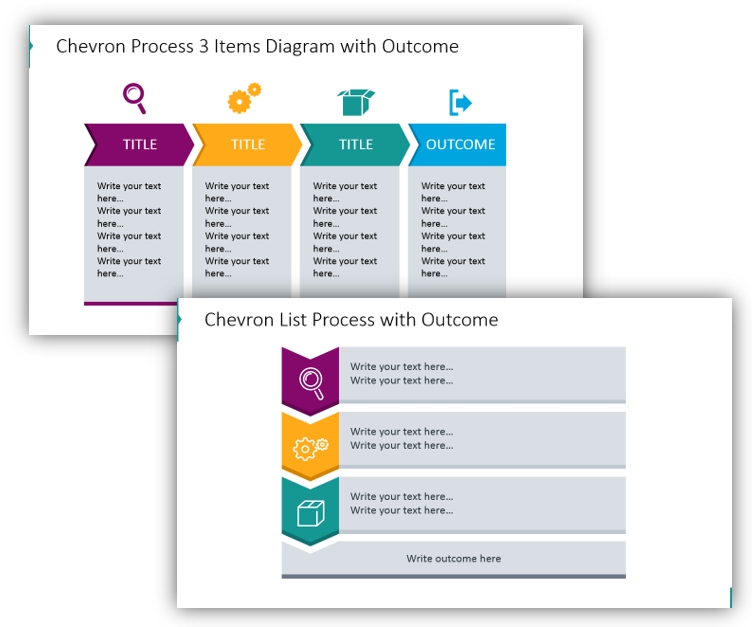
2. Illustrate a bulleted list
Outline chevrons can be used to reach a cleaner, modern look. You would use the outline icons the same way you would use the regular chevron icon sets. You can change the color of each chevron to differentiate the steps of your list or process. This image style can be used regardless of the number of steps in your process.
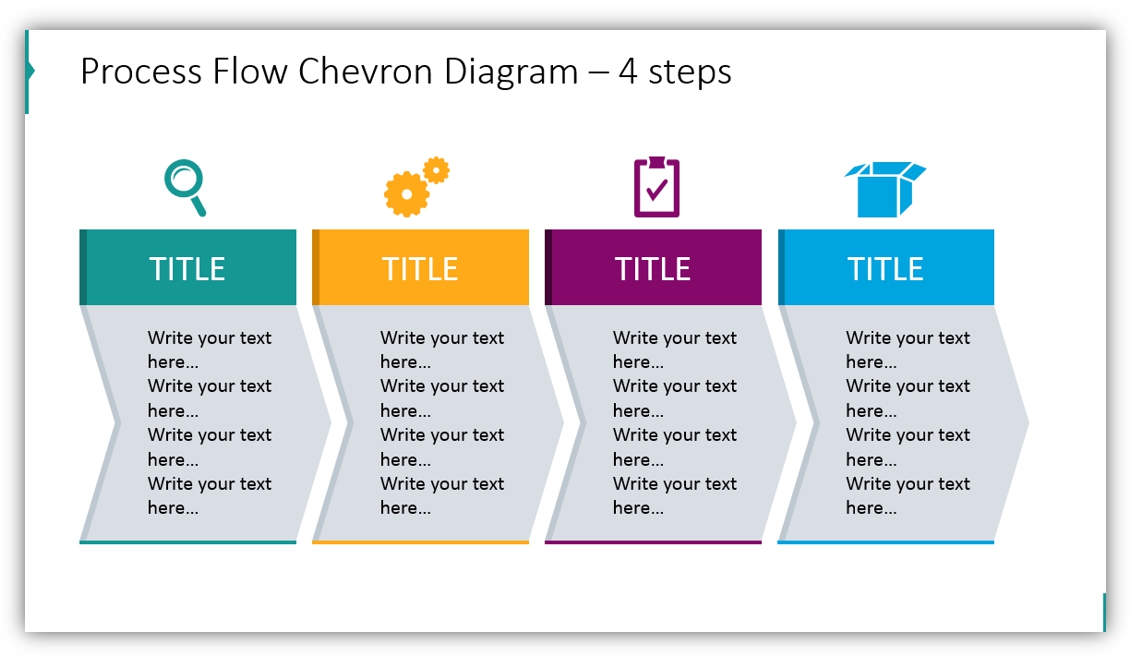
3. Present lists in colorful chevron rows
You don’t have to limit your lists to three steps. You can break each step down into several parts in order to present concepts completely. Also you can add a level to display the outcome of your list so your audience can see the goal on the slide.
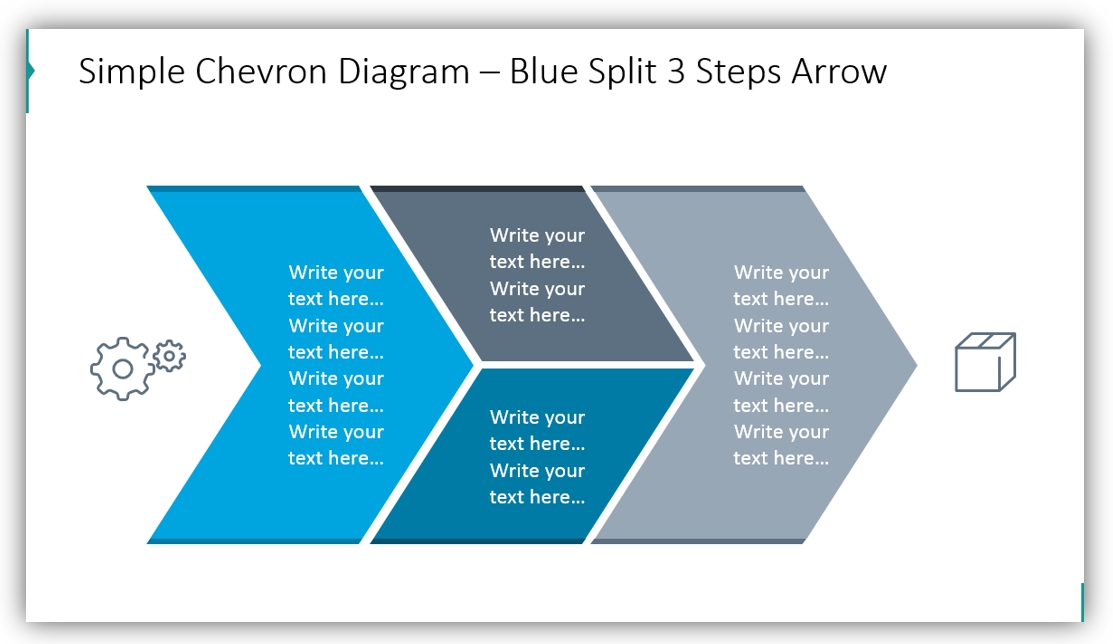
4. Create an alternative flow chart with chevron arrows
If you would like to illustrate many potential options, you can do so with chevron arrow icons.
5. Present creative, colorful input-output charts
You can use arrows and varied color palettes to make your points effectively. By customizing your arrow-based chevron charts and diagrams, you can present several structurally similar charts without fear of being redundant.
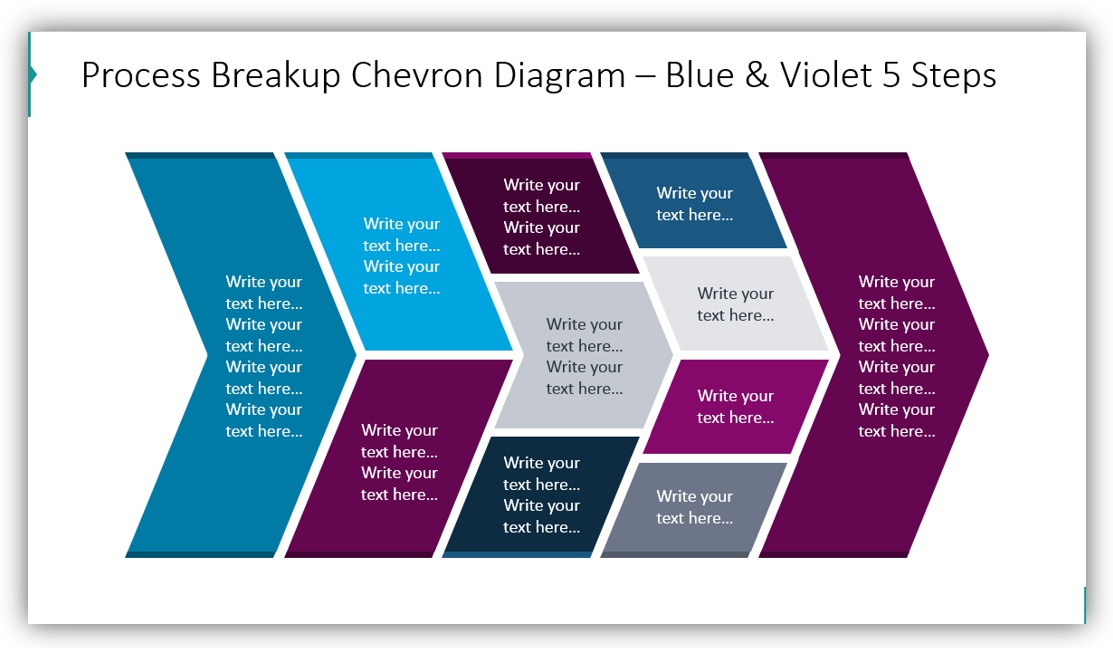
No matter what purpose you need your chevron PowerPoint graphics to serve, you can customize them to suit that need. Each icon in this set is fully editable. You can change the text, icons, colors, size, and more. Add shadows, put shapes behind or on top of text to get the perfect custom look.
Resource: Chevron Timeline Diagrams
To help your present timelines, processes, bulleted lists and flow charts in presentations we have created a chevron timeline diagrams PowerPoint graphics set. This icon collection includes 14 horizontal chevron diagrams. It also includes a few vertical chevron flow charts. The set includes layouts with anywhere from 3 to 6 steps. Some of the step arrows are split to express parallel events or multiple possible actions or results. The graphics are available in darker, filled-in styles and lighter outline styles.
As a bonus, this set also comes with 18 vector icons which represent common business concepts. The concepts range from data collection and decision making to implementation and outcome delivery. These icons will symbolize the different steps in your flowcharts and diagrams.
If you found the above examples useful or know of another way to use these icons you can download the full set, here.


