The Art of Product Presentation: How to Showcase Your Product Effectively in 2024
When it comes to introducing a product idea or selling a product, presentation…
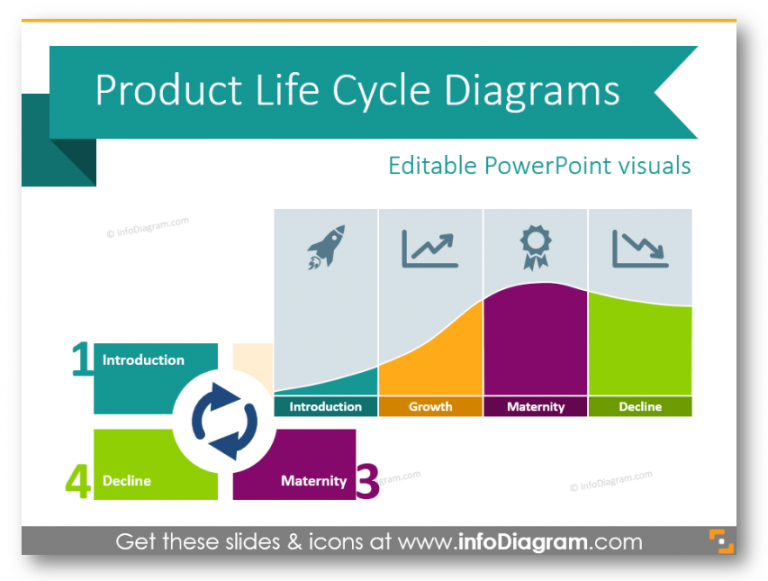
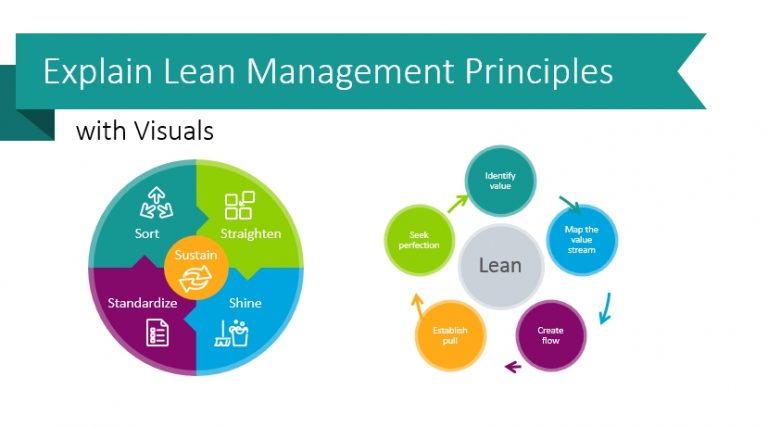
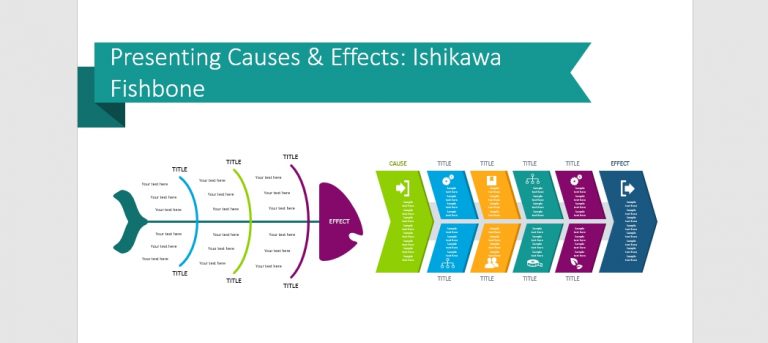
Illustration ideas for product development topics. Planning new products, project management techniques, or quality measures such as Six Sigma to performance reports and engineering root cause analysis.
When it comes to introducing a product idea or selling a product, presentation…
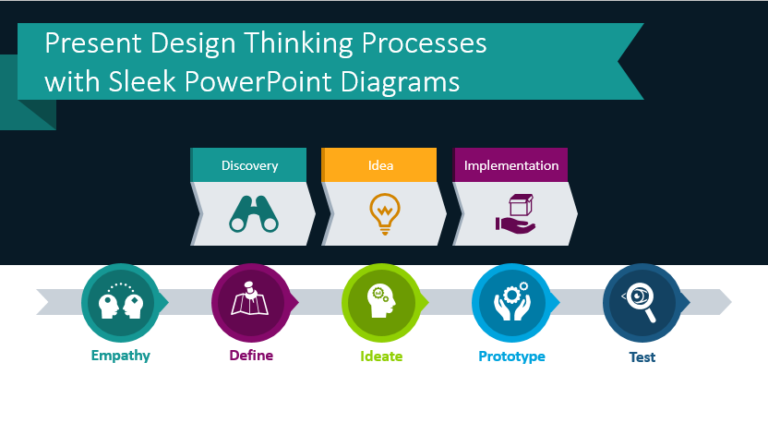
Do you use the design thinking process in or on behalf of your…

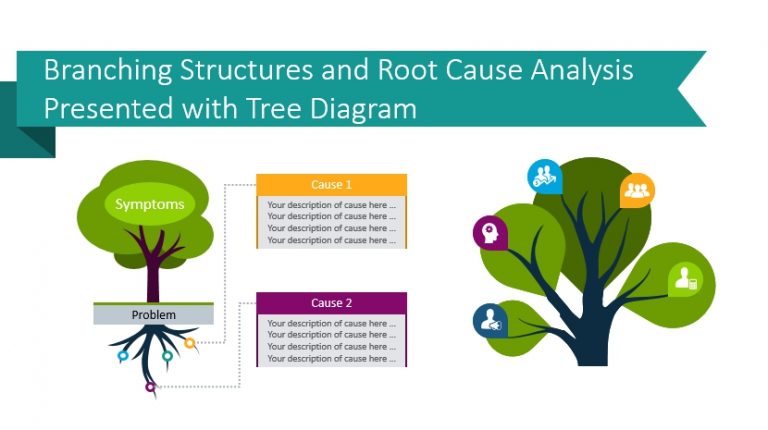
What is Root Cause Analysis, and how might it be helpful in your…
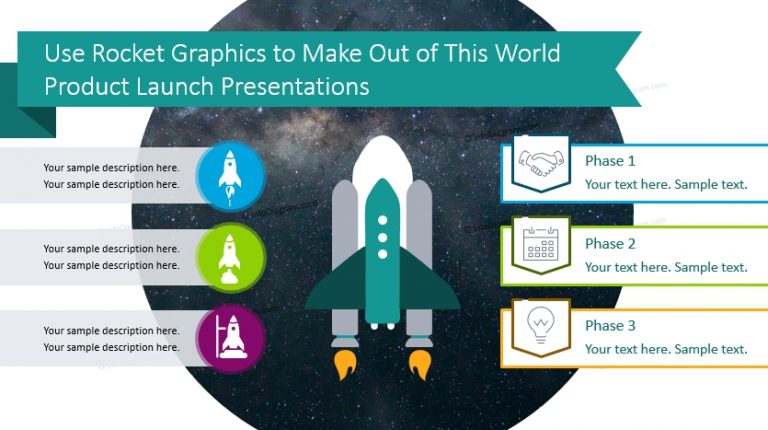
Leverage a clever visual metaphor by using rocket launch infographics or steps to…
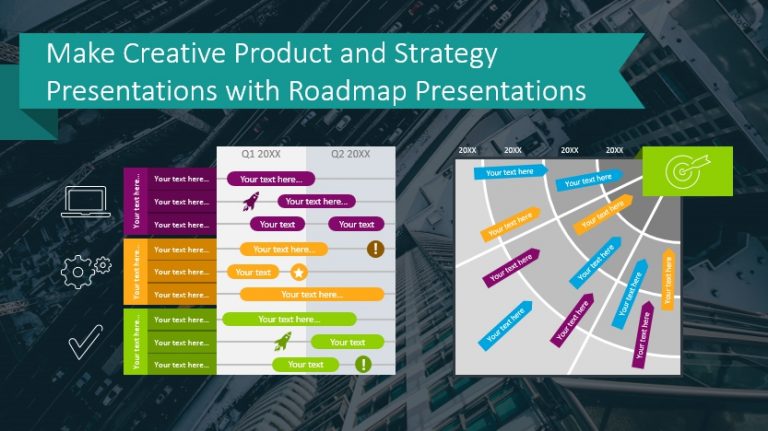
Roadmap tables graphic are a representation of the timeline for product development or…
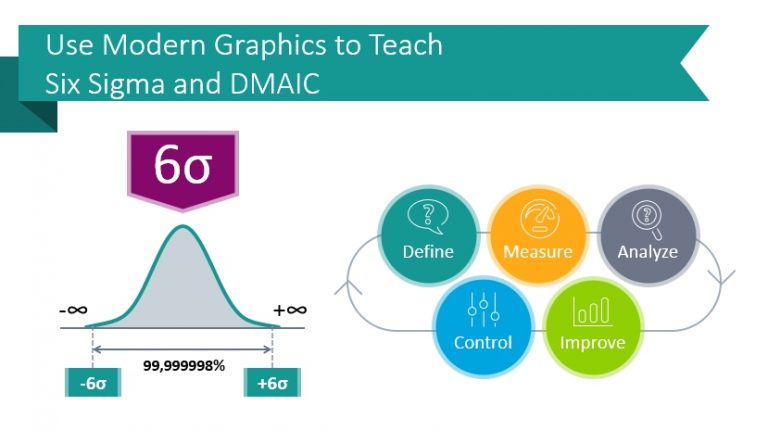
The Six Sigma framework was developed in the 80s by Motorola. The goal…
Working on a problem-solving presentation? In this blog, we are presenting 5 examples…