Root Cause Analysis Tree Diagram: Branching Structures for Presentations
Visualize root cause analysis with tree diagrams in PowerPoint. See branching structure examples and templates for problem-solving and fishbone presentations.
Trying to find a way to present a problem-cause relation creatively? A visual tree diagram is a suitable illustration for showing a problem root cause analysis, as well as various branching charts and hierarchies.
Explore our Business Performance PPT Reports category on the website for more resources to boost your presentation impact.
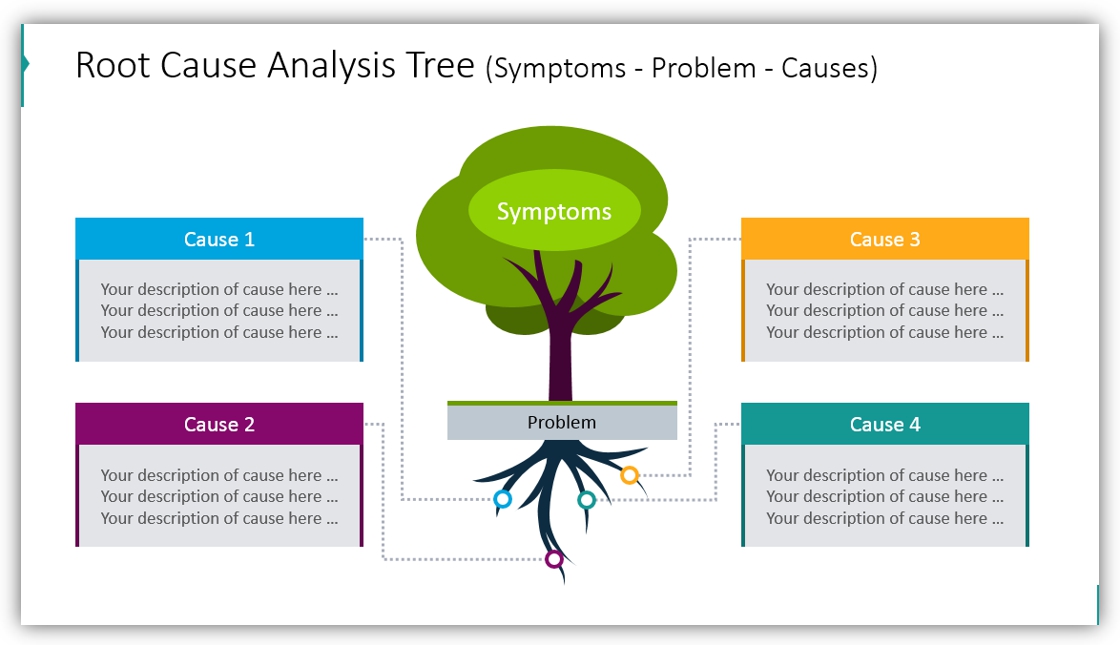
A tree diagram is a visualization tool for presenting problem-solving by root cause analysis of symptoms (visible as tree branches and underlying causes – hidden in the tree root). You can also use the tree branches image for representing various branching structures and hierarchies e.g. classical organizational charts or family trees.
You can get all slides from the Tree Branch Diagram Root Cause PPT Template (see details by clicking the pictures).
Why use a tree diagram to show root cause analysis?
Tree Branch diagram helps to present a business decision process, illustrate a procedure or show the decision logic. Bottom-up or top-bottom way, depending on what order of explanation you will choose. The Root Cause tree template will serve you for illustrating symptoms, problems, and causes in a creative way. Tree shapes help catch the attention of your listeners and avoid clutter on the slide.
You can also add simple animations to uncover symptoms, causes, and problems one by one. Each item can be illustrated by a specific icon so you will create a better association with presented topics. If you are missing any icons, see the Related Diagrams section for the PPT icons collection. Or write to us 🙂
You can see several versions of the tree diagram we designed – with less and more space for text, with and without icons, and with call-out boxes for adding explanations if needed. You can easily edit all of them by duplicating or removing items.
Why use a tree metaphor?
Generally, a tree is a great metaphor for showing top-down or bottom-up concepts, as well as hidden (root) and visible parts (tree branches) of the problem analysis. Branches themselves are a good representation of any hierarchy-based structures.
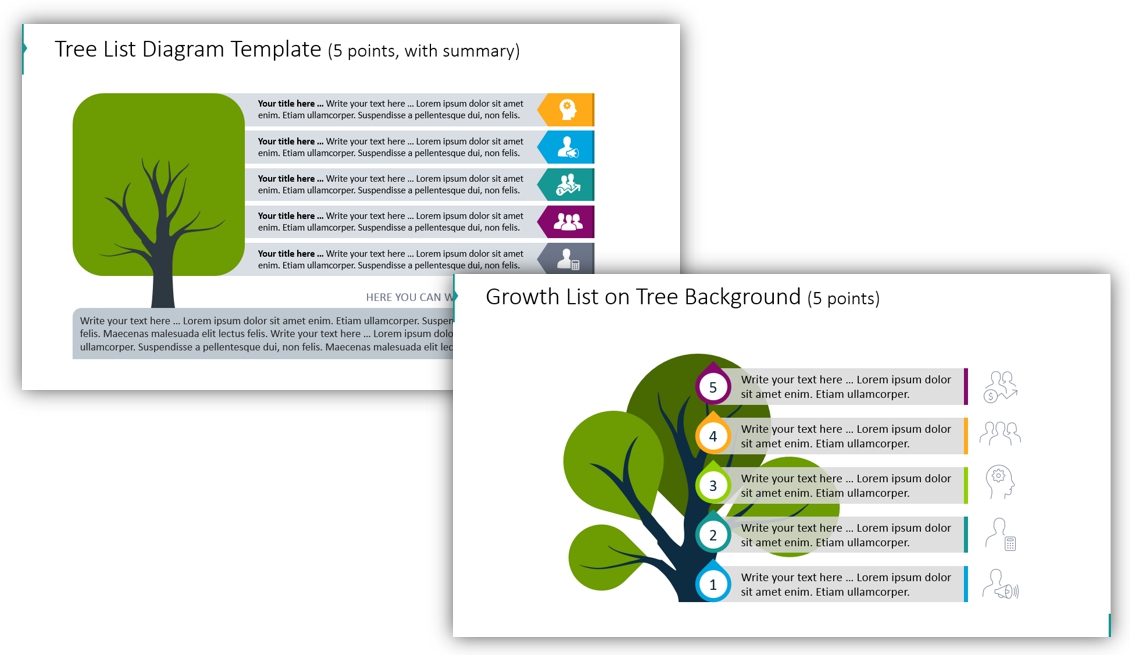
You can play around the tree on a slide as you want. For example, you can use such a variation if you want to state the points briefly and add a summary.
Creative Tree Diagram illustrative examples
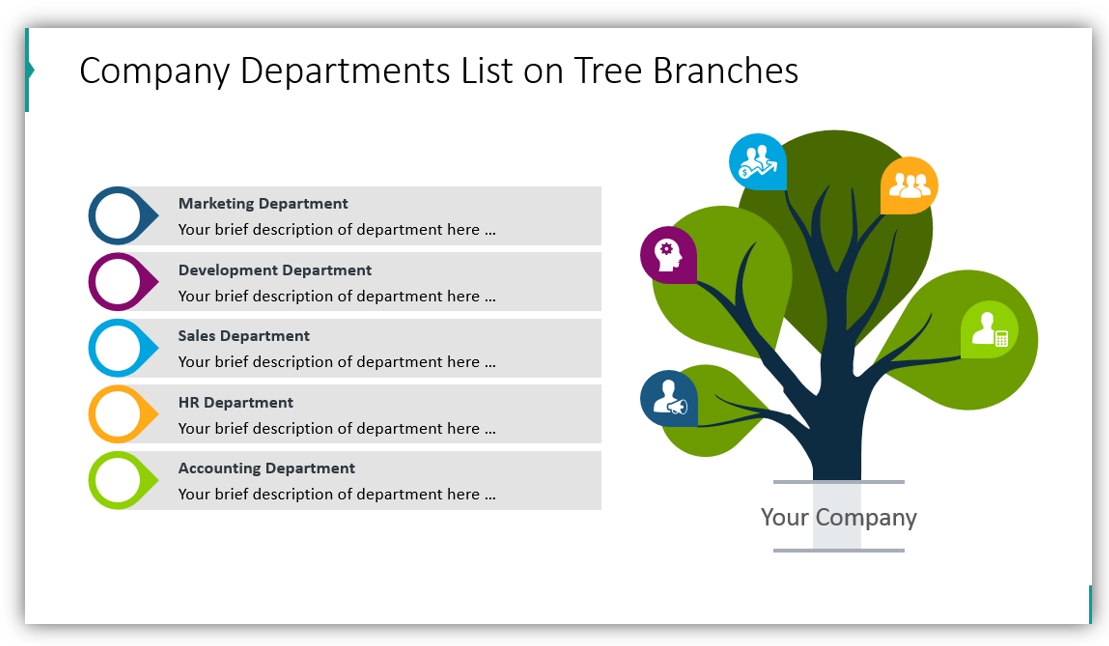
Presenting Company Departments List
To present such a common corporate topic on organizational hierarchy structures, we used a tree with branches, which symbolize departments by icons. On the left, we added five points which correspond with icon colors, for a short description of each department.
Problem Cause Symptoms – Solution Tree Infographics
As we mentioned, a tree can be used while talking about a problem root cause analysis. This slide is an example of such a concept: symptoms are presented above on the right, causes are below, followed by problem examples. A logical final is in the right part of a slide, highlighted with a header and color.
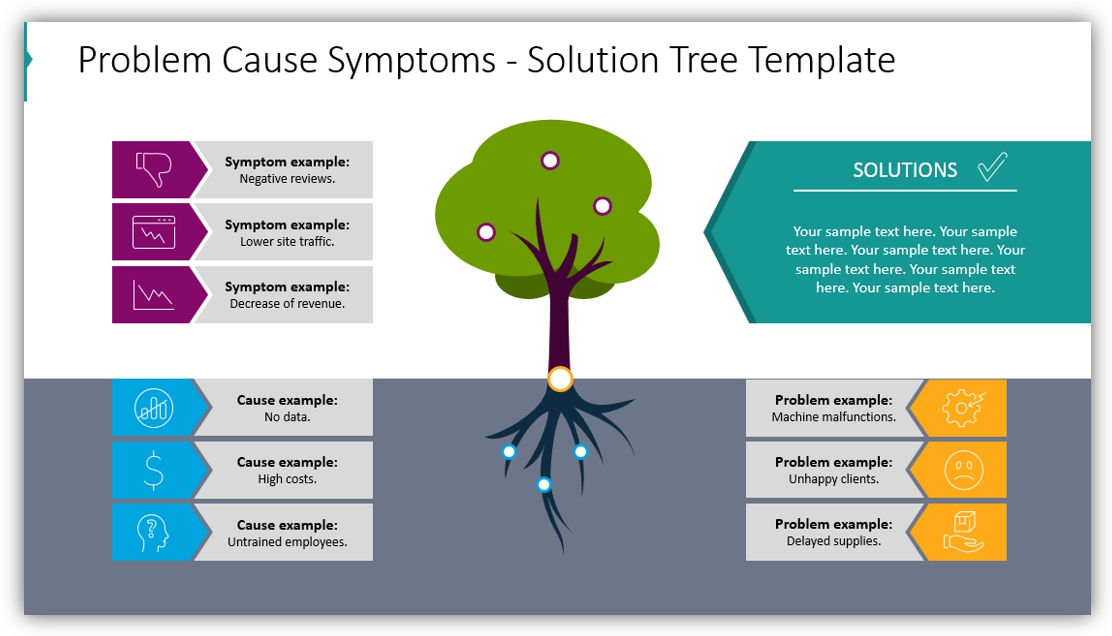
If you need to explain a complex root-cause analysis or problem-solving process, this slide template will be handy for you.
Check our YouTube movie with examples of how you can illustrate Root Cause Analysis concept:
Resources: Tree Branch Diagram Root Cause PPT Graphics
We hope our examples inspired you to make creative visualizations. If you like the slides above and want to save time, download the full collection ( also with icons):
If you are looking for a different type of diagram, check out our infographics bundle which includes 200+ creative PowerPoint diagrams, including timelines, lists, and comparisons.


