5 Uses for Creative Light Bulb Graphics
Do you need to express your bright ideas, creativity, or innovations in a presentation? If so, lightbulbs may be an appropriate visual metaphor. What creative idea or concept might your audience benefit from? With light bulb graphics, you can highlight new ideas or make lists with greater impact.
If you’re presenting strategic management concepts, you could use light bulbs. Click here to see the full Light Bulb Idea Infographics set.
What Could You Explain with Light Bulb Graphics?
#1: Compare Ideas

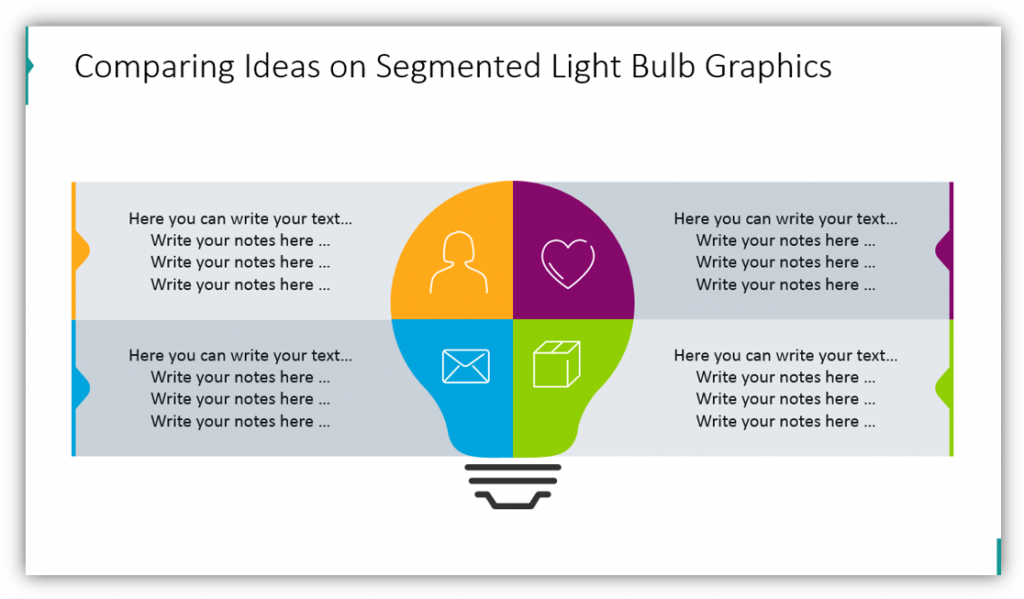
Do you need to compare multiple ideas or explain how one idea could manifest across different departments? You could easily accomplish this with segmented light bulb graphics. Each quadrant of the light bulb represents a different idea or a different department being affected by the idea or concept. Provide your audience with some supplementary details in the text boxes and add icons to better represent your idea.
#2: Conduct a Creative Idea Analysis

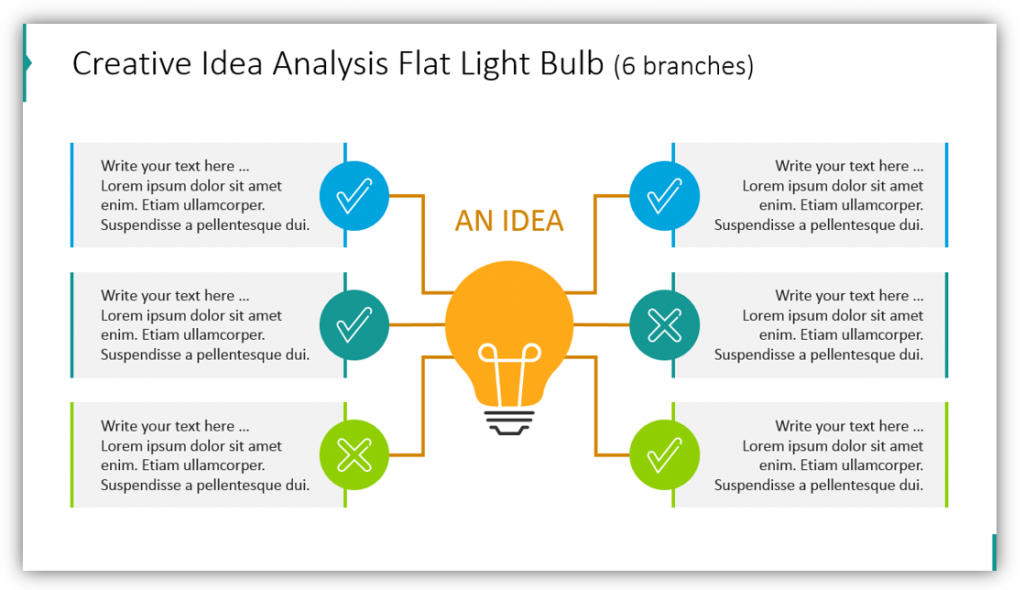
If you need to present an idea and want to show your audience that you’ve weighed all the pros and cons, you can conduct a creative idea analysis. In the example, one idea shows several positive aspects of the six branches and two negative ones. You can add additional details in the description boxes. You can also customize the colors of the checkmarks and x’s so they match one another, or follow the example and divide them by category.
Bring your ideas to life with light bulb icons, see the full set by clicking here:
Light bulb illustrations are a creative, unique way to share your bright ideas with your audience. Explain creative concepts in a new way using lightbulb infographics.
#3: Compare Two Solutions

If you have two potential solutions to a problem, you can show the data supporting either solution. In this example, the data provided is in Excel. Excel can provide you with some visuals. The charts and graphs Excel can produce are not very visually stunning. By adding a supplementary graphic, like the light bulb, you can provide a more visually interesting slide for your audience.
#4: Explain How to Use an Idea using Hand Drawn Ligh Bulb Graphics

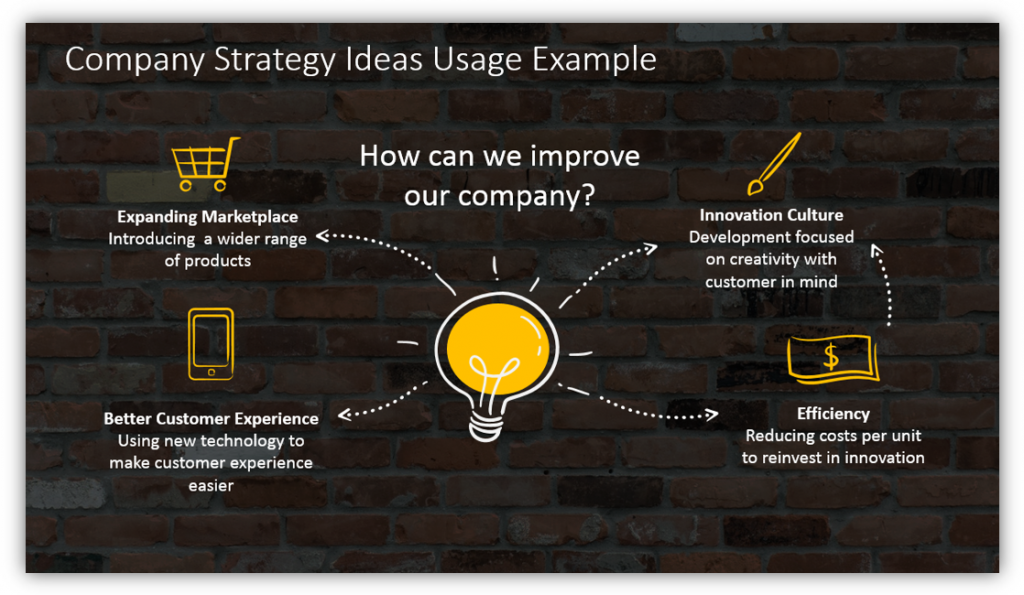
If you have a broadly reaching idea, like how to improve your company, you can address that need in many ways. In the example, you see the idea leads to expanding in the marketplace, providing a better customer experience, developing an innovative culture, and reducing costs and improving efficiency.
#5: Break Down How to Implement One Improvement

If you were to take one of the items from the previous example, how to improve customer experience, how might you do that? In this example, you can make a list of different ideas for improving the customer experience. Ideas for improving customer experience are personalization, appreciation messages, modern customer support, loyalty programs, and providing an emotional connection with your customers. This type of list could easily be replicated for any idea you might have for improving your business. The colors, icons, and a number of ideas offered could be modified to suit your individual needs.
You have many ideas for how you can improve your business, increase your bottom line, and make customer experiences more positive. Now with light bulb infographics, you can effectively present them to audiences of your choosing.
Resource: Light Bulb Idea Infographics
Modern, sleek, creative light bulb graphics are better than plain lists. Simple data tables and graphs are also not as effective at conveying information. Customizing graphics from this set to help them suit your purpose and serve your audience in many presentations to come.


