Use Target Bullseye Graphics to Make Objective Presentations Creative
Do you need to present your company objectives, goals, or targets? If you want to help your audience understand your message without dense text or confusing explanations, you need to use more engaging darts and bullseye graphics and visual metaphors. Consider that visuals might help you when expressing such ideas. The bullseye is the center of a shooting target, or the center of a target for a game of darts. It is a simple, instantly recognizable metaphor for a goal or objective.
How to use Target Bullseye and Dart Arrow Graphics?
Overall goals, annual goals, and quarterly goals are all easy to present with dart arrows and targets. Reduce the text on your slides while reducing confusion and making your presentation memorable.
Elegant slides will make your presentations interesting and engaging for your audience in ways text-based slides will never be. Click here to see the full Dart Arrows and Target Bullseye PPT slides set.
List Multiple Goals Represented by One Arrow
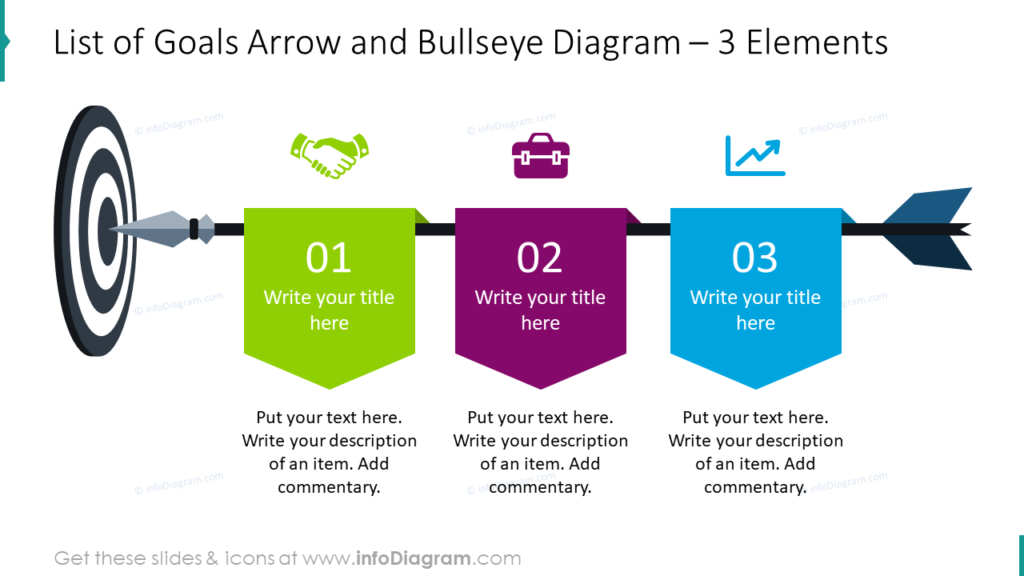
Your company has more than one goal. Every thriving business does! Your departments and teams probably have several different objectives and goals for themselves, as well. With arrow and bullseye diagrams you can provide a visual for all of the relevant goals you’re discussing on one slide. By customizing the graphics at the top, you can easily represent the different objectives in a way your audience will understand at a glance. There is even space to provide a few supplementary details if it’s necessary.
List Multiple Goals with Several Darts
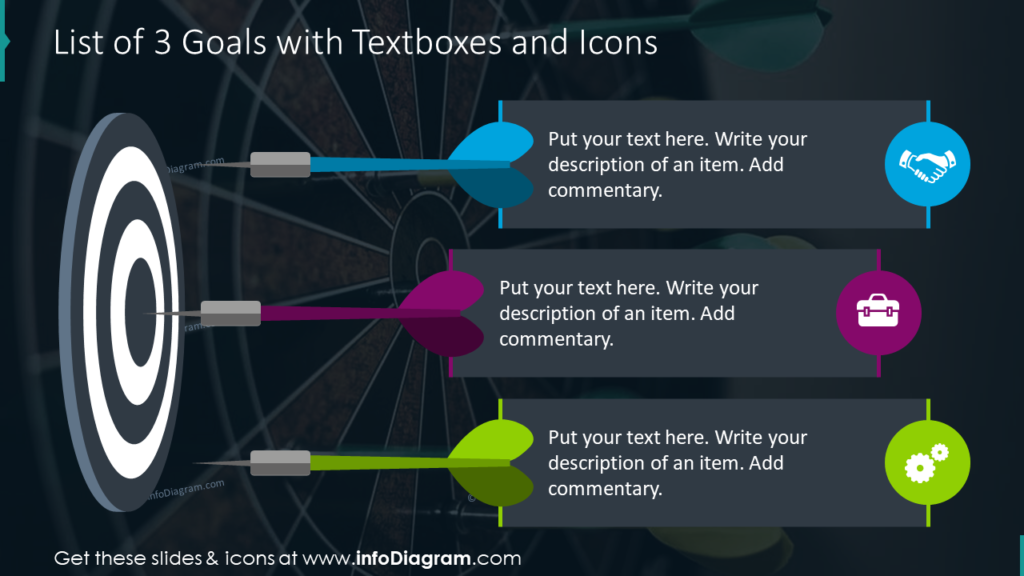
Rather than listing your goals as several banners on one arrow, you can present your goals as several darts. By keeping your visuals consistent, but diverse, you can help keep your audience from being bored or losing interest in the presentation. Customizing the colors, icons, and background are another way to help you keep your presentation fresh.
Utilize Different Layouts for Your Objectives Slides
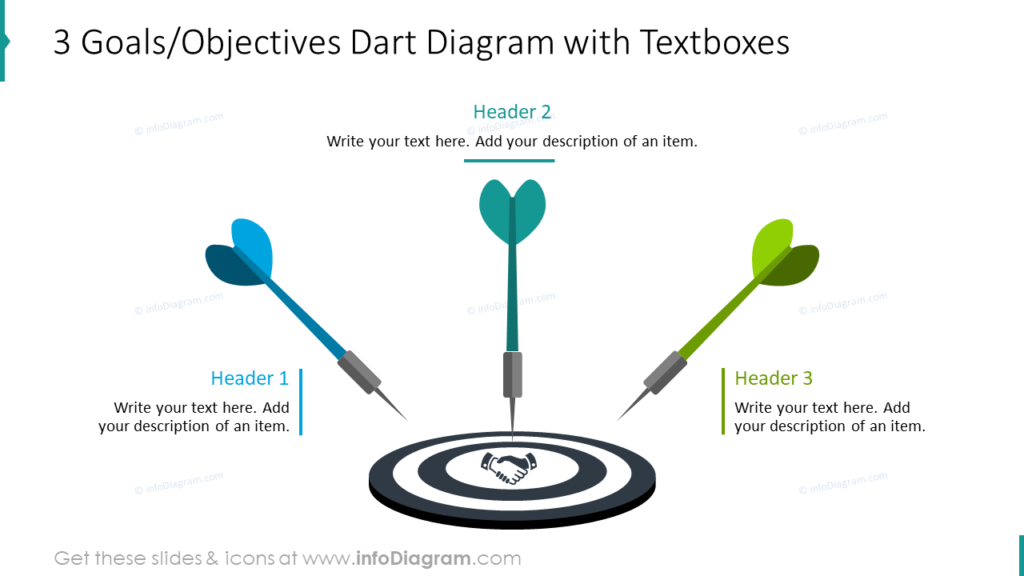
As we mentioned before, variety is an essential component. You want to keep your audience alert, and awake during your presentation. This sample utilizes a vertical facing bullseye. Instead of a wall-mounted dartboard, this example represents lawn darts. Since the text boxes aren’t placed in a linear pattern, it further differentiates it from the previous slide decks.
Present Several Goals Together with Dart Bullseye Graphics
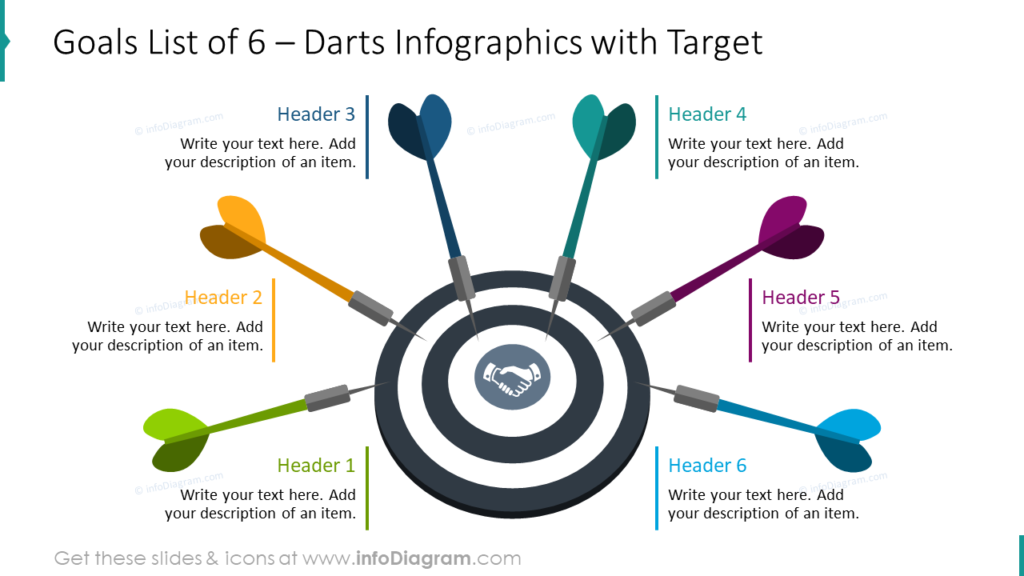
If you like to dream big, you may have many goals you want to achieve. You can present them all together on one slide using dart and bullseye graphics. If the goals are divided by different departments or teams, you could easily incorporate a color code so your audience would understand your message at a glance before you begin explaining.
Use Creative Circular Target Diagrams
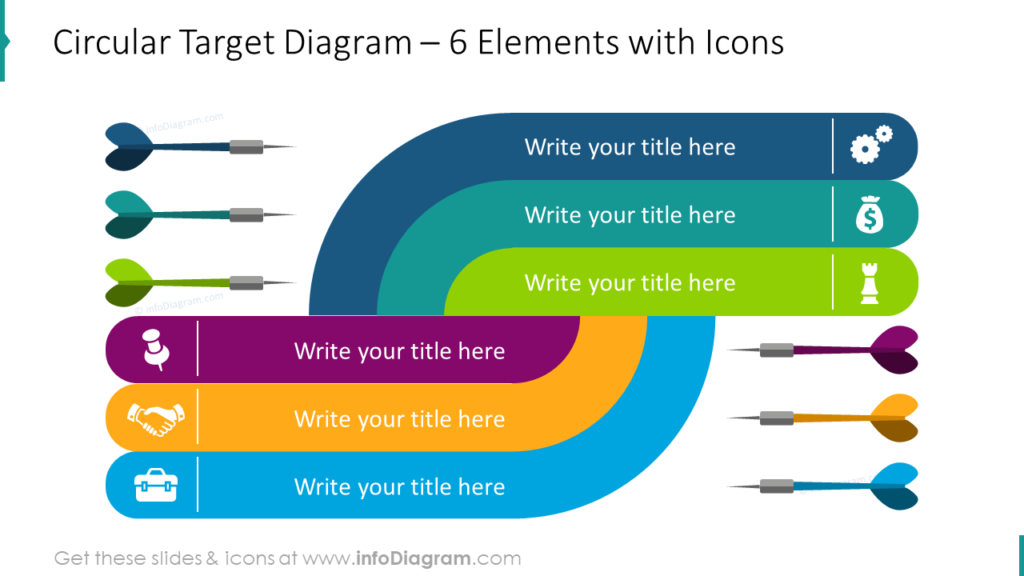
Want to get even more inventive? Not all of the graphics in this set closely resemble traditional bullseyes and darts. The circular target diagram, for example, puts a modern spin on the classic design. This creative re-imagining of a target reminds your audience of the original graphics, but puts a novel twist on it.
Contemporary Dart and Bullseye Graphics are effective tools
Whether your audience will respond better to traditional representations of a bullseye and darts or if you think they will appreciate the novelty of more modern interpretations – you can use personalized visuals to explain your goals and objectives. Don’t rely on boring lists to say what you could easily bring to life with Target and Arrow graphics.
Resource: Target Bullseye and Dart Arrows Graphics
Do you feel like your presentations of company goals and objectives are repetitive? Do you worry your audience will get bored? With Target and Arrow graphics you can articulate your objectives clearly, in cohesive impactful ways. Move away from boring, complicated tables and make use of engaging, professional-looking graphics.
Remember, building beautiful diagrams and graphics doesn’t have to be challenging. Using pre-made sets and visual metaphors will save you time, and make sure your audience understands your message. Click here to see the full set:
If you need additional graphics to harmonize colors and better customize your presentation, consider checking out our ultimate flat infographics collection.


