Use Creative ADDIE and SAM Model Graphics When Presenting Learning Frameworks
How do you help your audience conceptualize abstract ideas? If you need to make a presentation about learning theories or instructional design models, you need to plan your presentation carefully. If you’re explaining learning theories or making an educational presentation it can be difficult to break down instructional design models into easy-to-understand ideas.
Turning those ideas into slides only makes this process more difficult. We know many struggle with these issues, which is why we created the
instructional design models graphics set. Do you think you could benefit from an easier way to explain and utilize instructional design models? Keep reading and see!
Do you utilize any of the instructional design models in your own training, or encourage others in your organization to do so? Check out the full Instructional Design Models diagrams set, which contains ADDIE, Kirkpatrick Levels of Training, SAM, and MPI frameworks.
Present the ADDIE Instructional Design Model as a Cycle
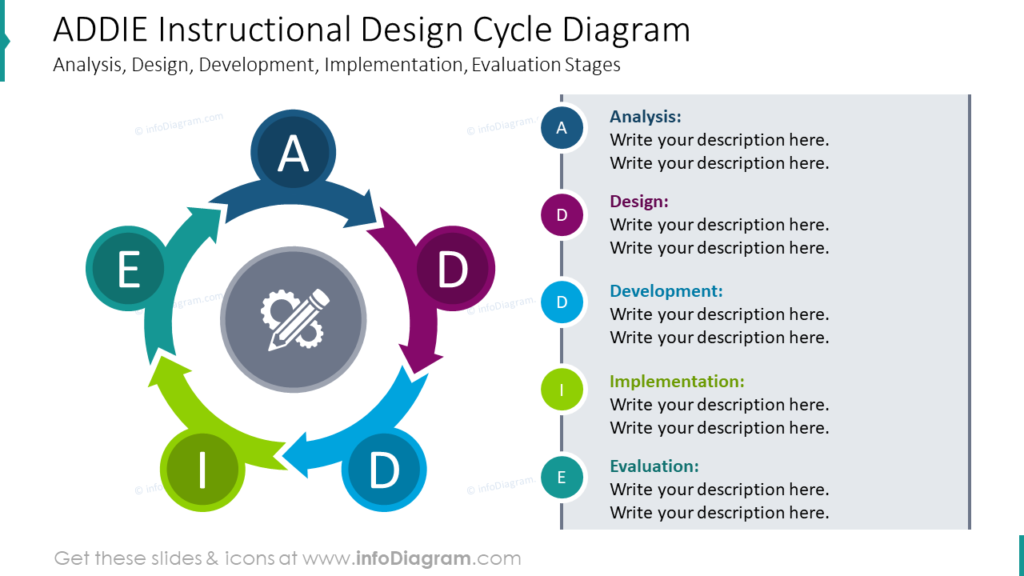
Whether you’re educating your audience about what the ADDIE Instructional Design Model is, or you’re organizing your own process, sharing the ADDIE model as a cycle is a unique, easy to understand method which is appropriate for most audiences regardless of their level of background familiarity with the topic. Instead of listing the different phases or presenting the information in a complicated table, a cycle provides a familiar, attention-grabbing alternative. Your audience will appreciate your creativity and will be more likely to retain your message.
Utilize More Visually Interesting Graphics When Constructing Flow Charts
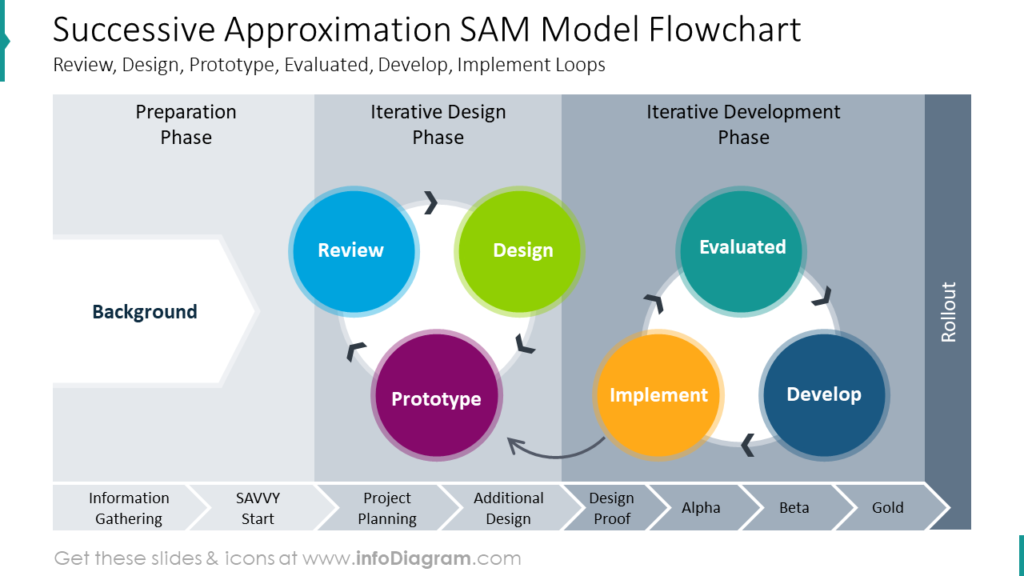
The SAM flow chart in this example is multi-faceted. It provides the essential phases: Preparation, Interactive Design, and Iterative Development, but also gives you space to describe what steps are necessary during each part of the process, but not in a way that is overly wordy or confusing for your audience. In the example, you’ll notice that a lot of information is shared, but without using many words. This helps reduce confusion and keep the audience focused on listening to your message, instead of on reading your slides.
Get More Creative, Use Chain Diagrams with the Kilpatrick Levels of Training Model
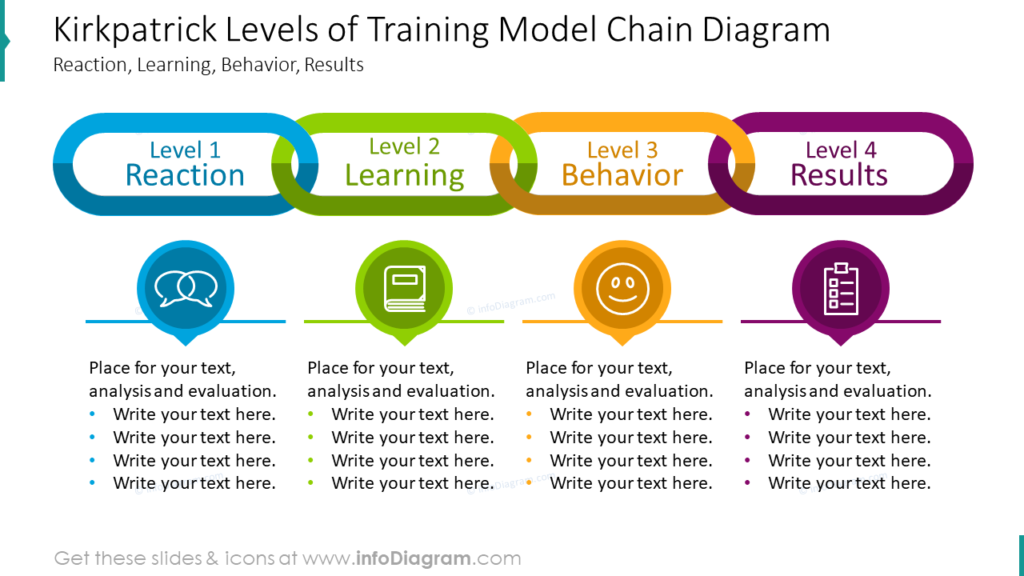
Flow charts, cycles, timelines and the other graphics included in this set are creative, eye-catching visuals you can put to work for many presentations. However, if you really want to think outside the box and communicate your idea, our designers included clever alternatives like the Chain Diagram in the example slide. In this type of slide you are free to customize, add, or remove any of the included text as well as modifying the colors and adding icons to represent each level. We were sure to include many options so that you would have the freedom to choose the style of slide which suits your message, organization, and audience best.
Use Impactful Timeline Graphics Instead of Boring Tables
Step-by-step guide on How to Explain Learning Theories Visually with Instructional Design Models
- Prepare a tag shape for each item on your list. Do this by using 3 PowerPoint default shapes and then duplicating the completed tag. Connect the tag with a rectangle shape to begin forming your “line” for the timeline.
- Add the necessary text. In this example, that involves adding initials that represent each step in the framework, headers which provide some additional detail and context, and any additional description text which is necessary.
- Decorate the slide by adding colors to the tags, rectangle shapes, and your text. You can also add additional icons to better represent each step.
Resource: Instructional Design Models (ADDIE, SAM) diagrams
We created the instructional design model diagrams set to help individuals like you present full ideas. See the full collection here:
We know that beautiful, understandable charts are an important part of every successful presentation. Our designers know how important it is to come up with new ideas, especially for those in training roles or who present often. That is why they ensured these concise graphics and icons are user-friendly, visually appealing, and easy to understand. If you’d like more options for customizing presentations made with this set, check out this collection of professionally-designed infographics templates.