How to show Benefits or Features Creatively [PPT guide]
Have a presentation where you need to show the benefits of features? Or product characteristics?
Let’s show it in an atypical creative way.
We have prepared some inspirations for such slide designs.
Explore our Business Performance PPT Reports category on the website for more resources to boost your presentation impact.
Presenting the list of benefits is the crucial part of a presentation. You want people to focus on this list. It should not be lost among other presentation slides.
Therefore use a design that will be different. This will attract the attention of your audience.
How can you show on a presentation slide the benefits of the solution you present?
Here’s my little ranking of ideas:
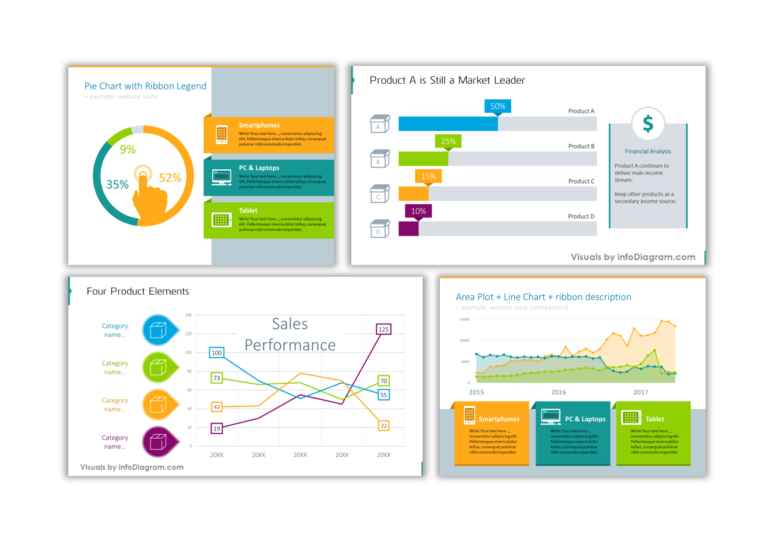
- The worst thing is to hide benefits inside long text sentences on a slide. Avoid using this at all costs.
- Not so cool is also listing benefits as a standard bullet point list (as I do here – it’s good for written documents, but not for a presentation that should be outstanding)
- Changing the list to a set of simple shapes (rectangles, squares, circles) is a bit better
- Enhancing the shapes list with illustratory icons is even better
- Giving these shapes a unique hand-drawn look is my top suggestion for you.
You can download all presented pictures in the form of editable Infographics for PowerPoint Templates here.
Some ideas on how to change classical bullets into the original diagram are below. All those shapes are available in hand-drawn infographic diagram slides.
Apply scribbled hexagons or circles: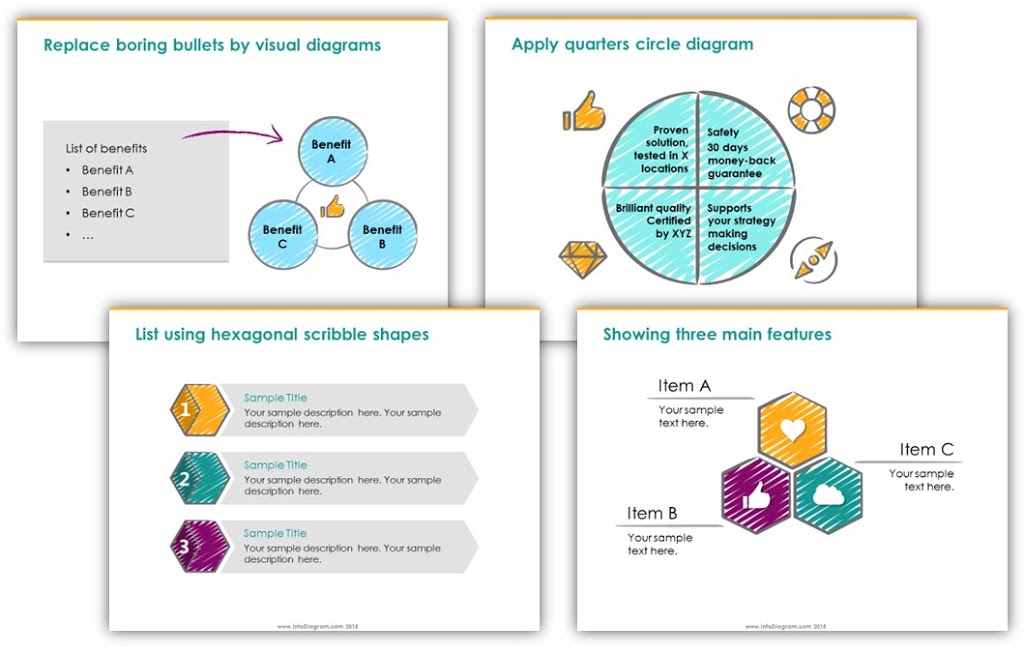
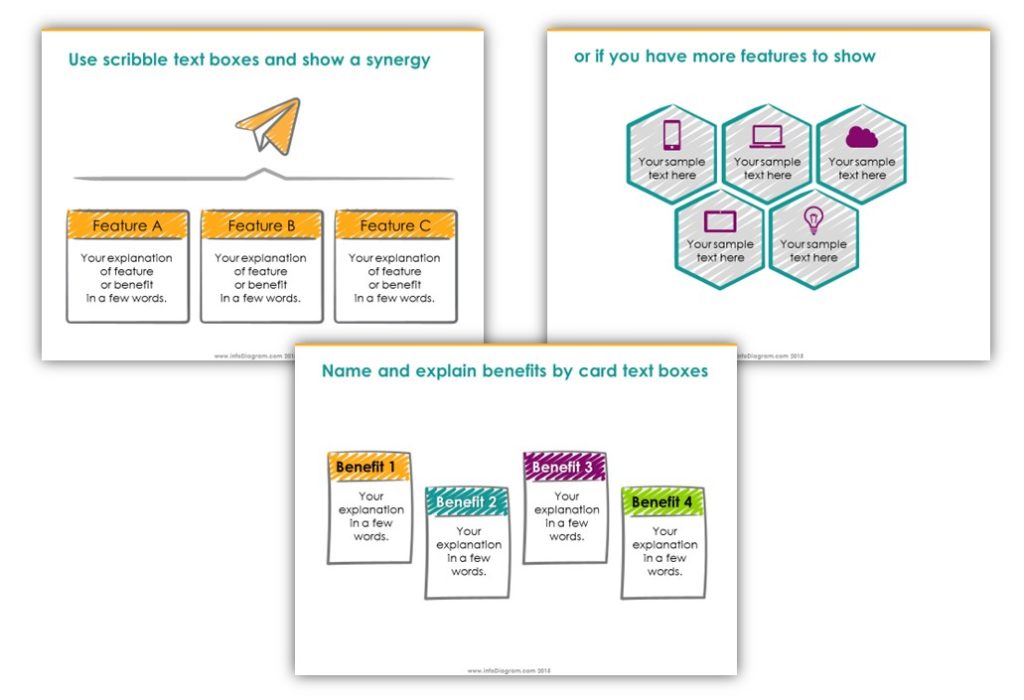
If you need to add also the explanation for each item, use scribble head text boxes or shapes accompanied with flat icons:
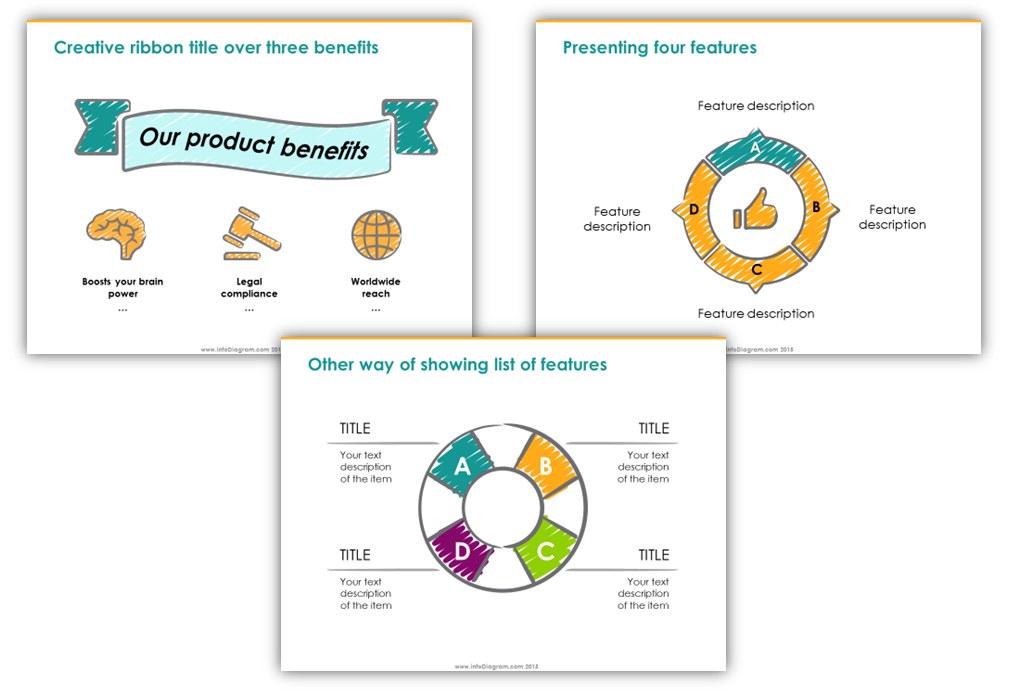
Or apply ribbon as a title with icons for each sub-item. Or other circle shapes as these:
How do you create such infographics?
You can create it yourself using basic PowerPoint shapes. Or get predesigned shapes here:
A friendly hint :): firstly get a free sample, there is a discount code inside.
For more inspiration, subscribe to our YouTube channel:
Further reading on using diagrams instead of text slides:
This article is Part II of the series “Replacing Text Slide with Infographics Shapes”. See the other two parts:
- Using Timeline diagrams infographics
- Presenting Key Data Values on a Slide
PS. Quick question: How many points do you usually use on a slide with benefits or product features? Less than five? Less than ten? More? Leave me a comment below.
Looking for more creative presentation graphics? Get on our newsletter and never miss an announcement. You’ll stay informed about all of our new updates. Plus, if you sign in for our newsletter you’ll get a Creative slide design guide with free hand-drawn shapes, absolutely free!