7 Design Ideas for Group Development Chart Slide
We’re all working in teams. If you are a project manager or team leader, it’s inevitable to understand all the stages of group development, recognize the phase where your team is at the moment, and be able to visualize them.
Elevate your business performance presentations with our curated resources – visit our financial performance PPT reports webpage.
Below you can find several ideas for presenting team dynamics stages in a visual form. Whether you are managing a group or doing team-building training, consider using some kind of diagram illustration to explain this typical group behavior process.
You can get all the icons and slides from the Group Development & Dynamics Chart collection (see details by clicking the pictures).
While we were designing those process diagrams, we wanted people to focus on their presentation content dedicated to team dynamics, not wasting the time on designing the charts from scratch.
One of the first user’s feedback is:
Team Dynamics model allows the team members or managers to understand the process the group of individuals is going through while becoming a mature team. It empowers to manage better the challenges of the phases, avoids frustration and negative emotions, while showing the way forward.
Mirna Smidt,
trainer of positive psychology & professional skills at mirnasmidt.com
Tuckman’s Group Development Model
Managers must be able to recognize and understand group behavior at its various stages.
Perhaps the best-known scheme for group development was advanced by Bruce Tuckman in 1965. Initially, Tuckman identified four stages of group development, which included the stages of forming, storming, morning, and performing. A fifth stage was later added by Tuckman about ten years later, which is called adjourning.
Tuckman didn’t just have a knack for rhyming. (Although, it does make the stages easier to remember.) Each is aptly named and plays a vital part in building a high-functioning team. If you are interested, read more here.
7 Ways to Illustrate Group Development
In this blog, we’re listing seven examples of how you can show group development on a slide and make it look professional.
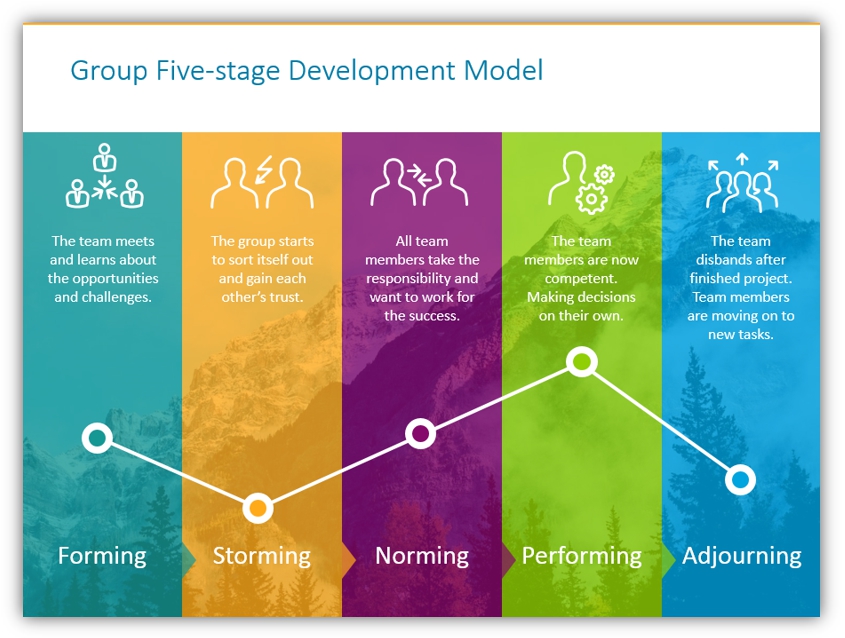
Multicolored Timeline with Background Picture
When you put a different color on each stage, it’s easy to distinguish them from one another and focus the attention of the audience on the one you need.
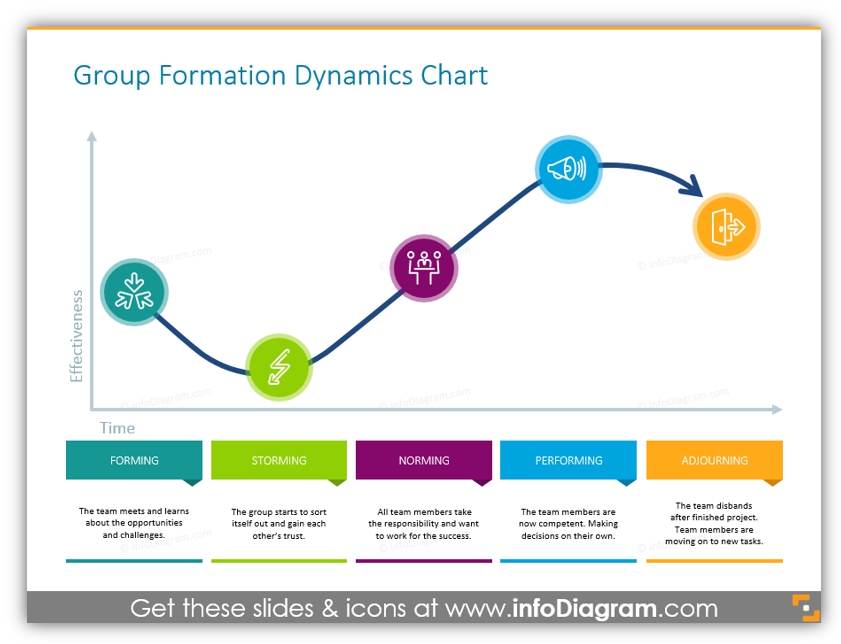
Group Formation Dynamics Chart
This is the example of the group development chart, on which stages are connected with the effectiveness of the team during each step.
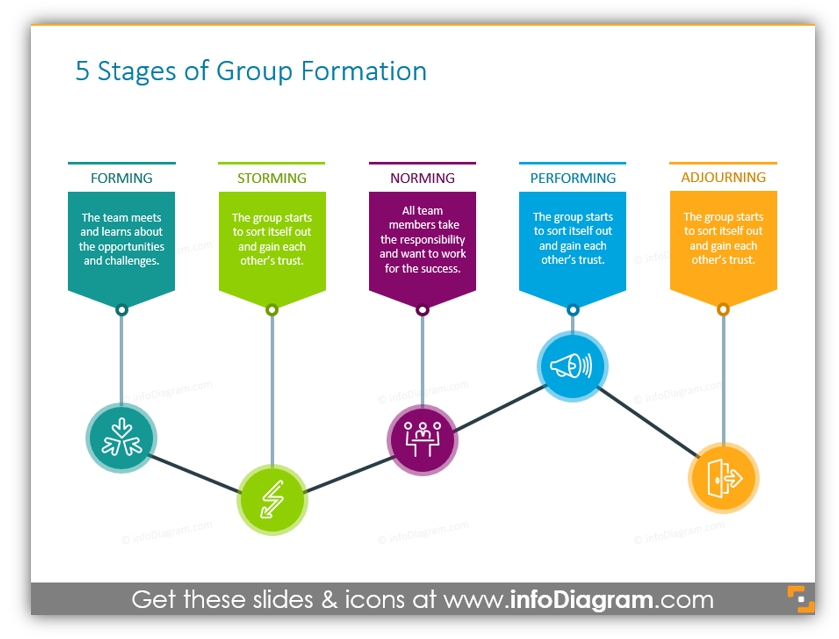
Five Stages of Group Formation Diagram
Here the description of each step is connected with a particular stage, illustrated with the icon.
3D blocks of Team Formation Stages
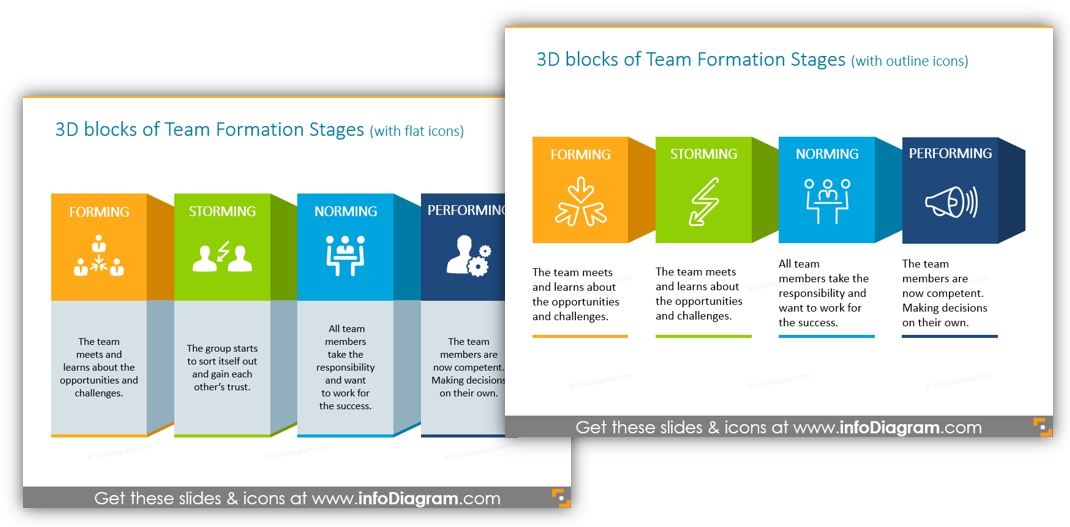
The next style you can apply within slides is 3D cubes – with the outline or flat icons, both suit well 🙂
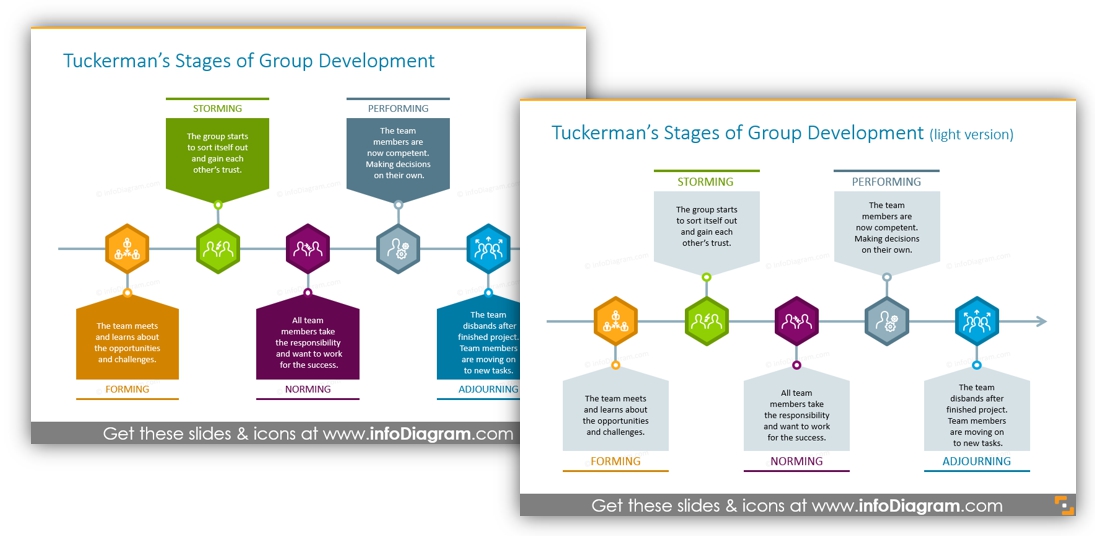
Tuckman’s Stages of Group Development Timeline
Stages can be presented as a timeline as well, especially if you want to put some text above and below the line. We prepared two versions – colored and light.
Simple Diagrams with Outline Icons
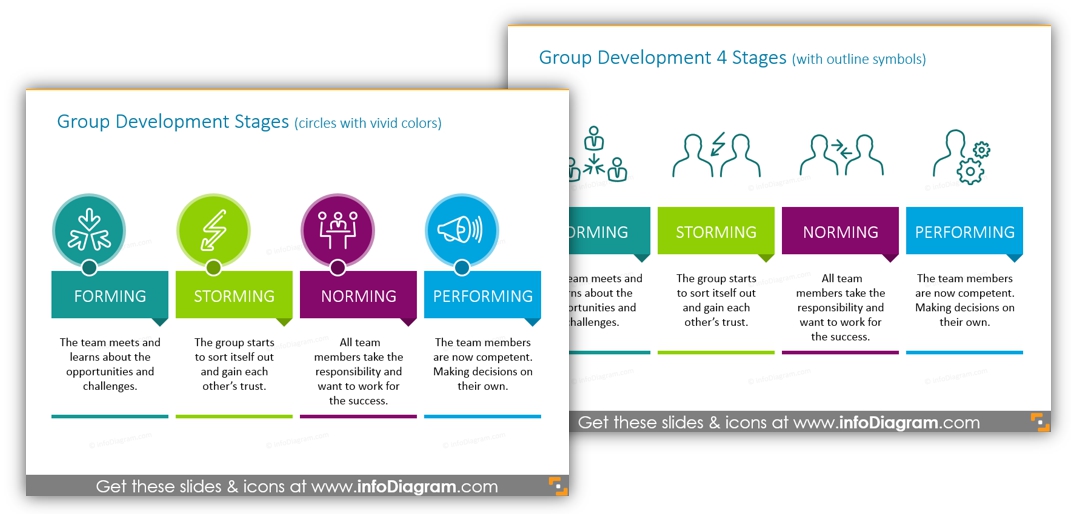
At infoDiagram we love symbols 🙂 Icons are always a good idea because they don’t take up too much space on the slide and you can show any concept with their help. These examples are made from scratch in PowerPoint: shapes + icons.
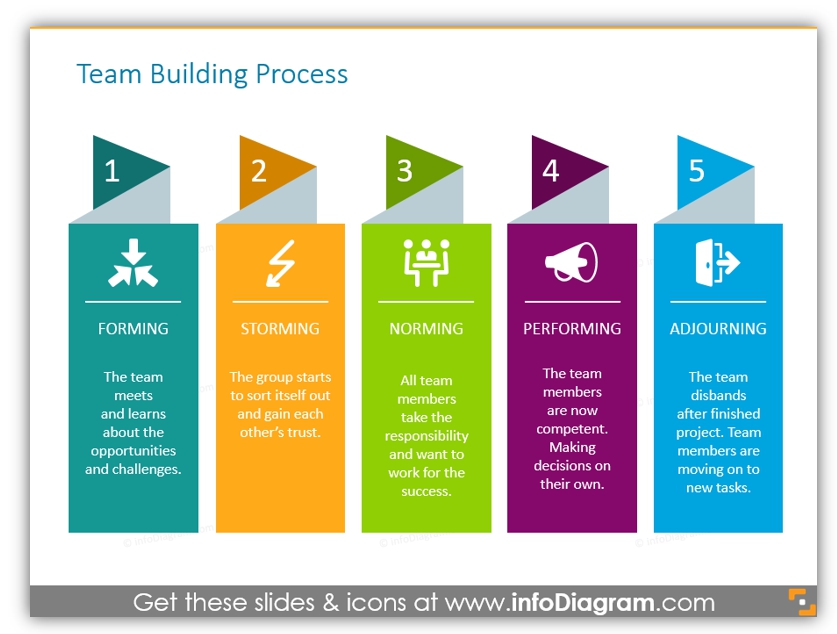
Team Building Process in a List Form
This variant is creative enough and at the same time formal so you can apply it to official or corporate presentations. Colorful stages with flat icons make a good mix.
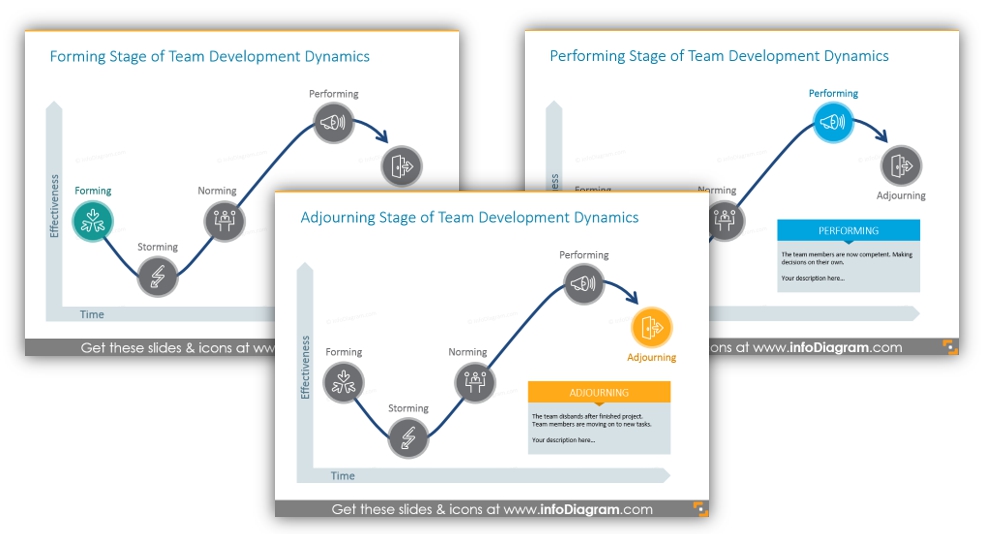
Illustrate Each Stage of Group Development
If you need to focus attention on a particular stage, then you can use a chart where it is highlighted with the color:
- Forming: The team meets and learns about opportunities and challenges.
- Storming: The group starts to sort itself out and gain each other’s trust.
- Norming: All team members take responsibility and want to work for success.
- Performing: The team members are now competent. Making decisions on their own.
- Adjourning: The team disbands after the finished project. Team members are moving on to new tasks.
Optionally you can put a description or your notes beside.
Apply more visuals within your presentations, and get inspired by our examples 🙂
Explore our YouTube channel for more creative inspiration:
Resources: Group Development & Dynamics PPT FlowCharts
If you want to save time, you can use the pre-designed diagrams from our infoDiagram collection. With this template you can illustrate various stages of team development according to Tuckman’s model: Forming, Storming, Norming, Performing, and Adjourning.
You can see the full diagrams collection over here:
The collection contains PowerPoint shapes you can adapt to your presentation (you can modify the colors of diagrams and icons, and resize charts without quality loss).
If you need more general diagrams, see this infographic PPT graphics bundle.


