How to Make Modern Organizational Chart in PowerPoint
Looking for a way to make your organizational chart look creative and modern? Then it is the right place. Today I’m gonna give a few hints and resources for quickly designing such HR structure diagrams using PowerPoint.
Explore our Business Performance PPT Reports category on the website for more resources to boost your presentation impact.
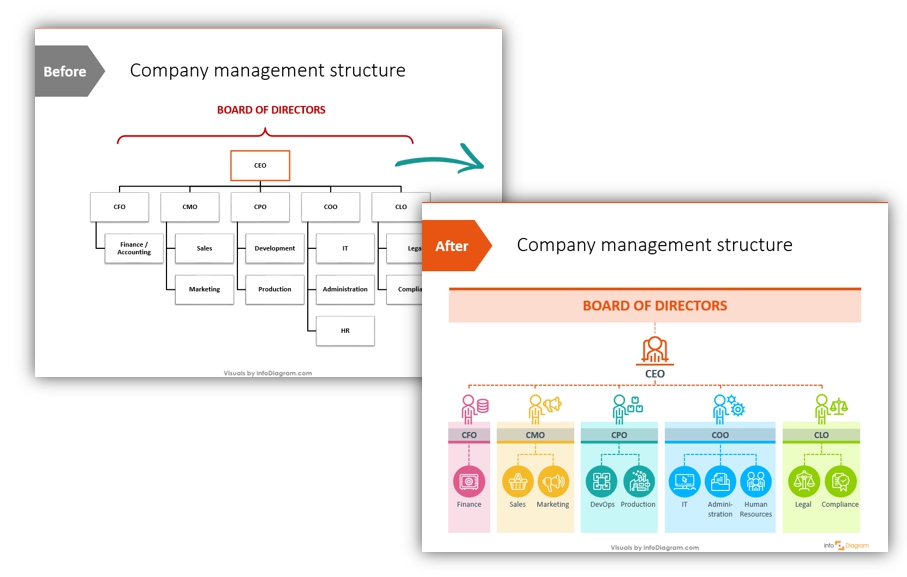
This is how the org chart slide looked before and after applying rather simple design face-lifting:
Download all the icons and slides from the Company Roles and Department Structure Outline collection.
Here’s a step-by-step instruction on how to create such a modern-looking flat-style organizational chart.
A quick guide on facelifting an organization chart:
1. Draw a basic organizational chart structure e.g. using a PowerPoint SmartArt diagram
The MS Office SmartArt is a basic easy tool for creating various diagrams such as hierarchies, processes, or cycles. However, the default SmartArt is not very attractive. Therefore with some additional tweaks, we will show you, how you can create neat organizational infographics.
To create the SmartArt object, open the menu (Insert -> SmartArt), go through variants, and choose one that suits you best. In the case of drawing a company structure, it’s a hierarchical tree diagram.
2. Modify the org chart to give it a modern look
Choose the most simple color style from SmartArt options, and avoid all gradient and 3D bevel options at all costs. They are making your graphics less readable and old-looking. We suggest choosing a flat style, color or a grey one. Then remove the default outlines given by the SmartArt tool, to create more modern flat-style graphics. You can use your brand colors to illustrate the main departments or positions, for example. Once you create a SmartArt hierarchy more-less fitting your desired structure, change SmartArt to a set of shapes (by applying the ungrouping function). This allows you to work more freely with your organizational chart.
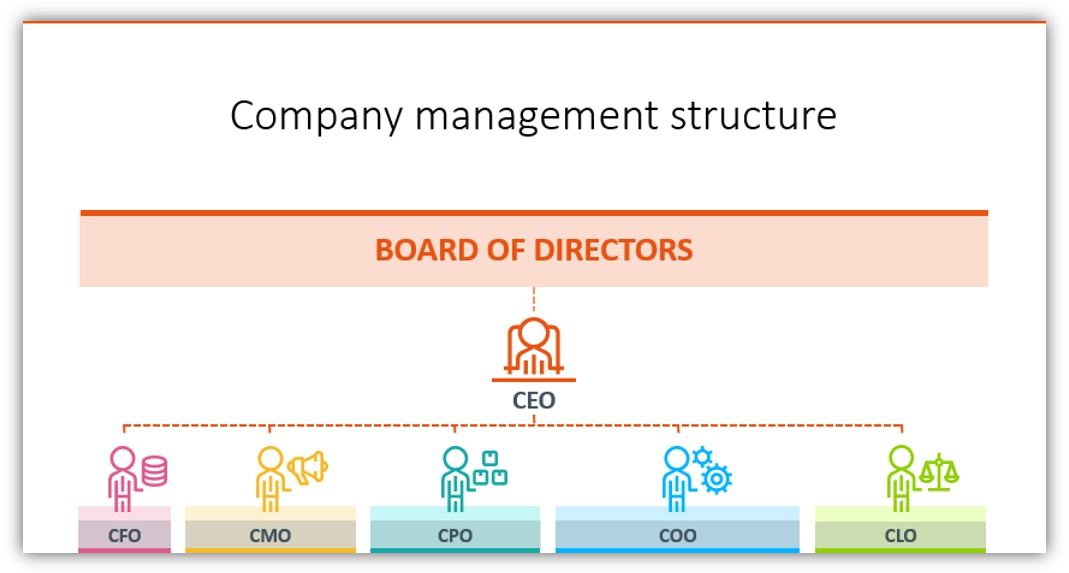
Here’s an example of how you can alter a default chart to create something less obvious – by adding a simple bottom line shape:

On our slide, we used five colors for five departments (plus we altered the color of the main icons), which made it easy to distinguish one from another.
3. Illustrate the key company roles and departments with specific icons
Think about what is associated with every position and add a symbol associated with this position to create a more interesting org chart.
In our case, we would cover the main C-level roles with those metaphors and symbols:
- Chief Executive Officer (CEO) is a person sitting on a high chair
- Chief Financial Officer (CFO) as an avatar with cash – coins or money symbol
- Chief Marketing Officer (CMO) with speaker
- Chief Product Officer (CPO) with boxes
- Chief Operational Officer (COO) with gears
- Chief Legal Officer (CLO) with scales
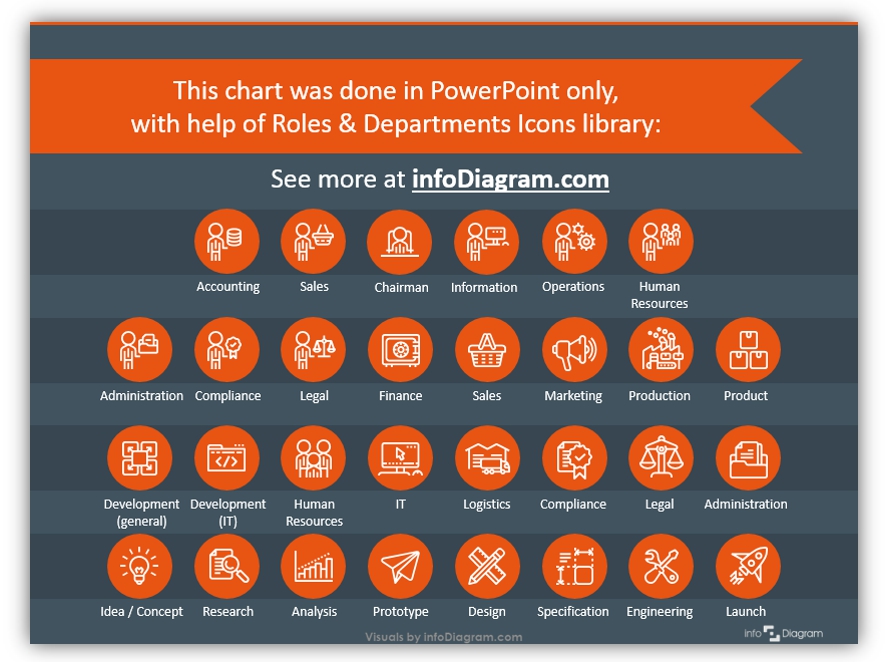
Below is an overview of various company role icons (click on the picture to see the source slide):
Get inspired by more organizational chart examples
Do you want something more, than an ordinary chart? Check those HR diagram templates and see if you can use any of them in your presentation:
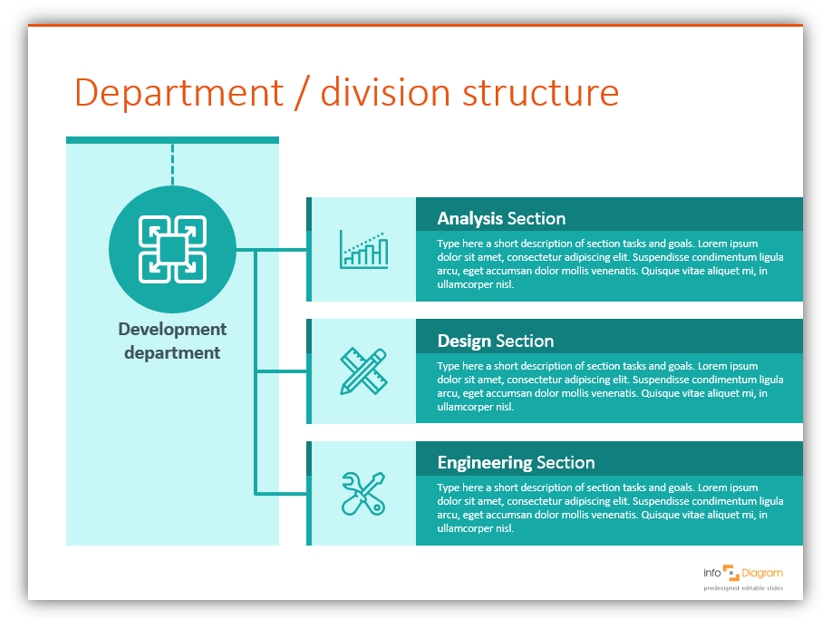
- presenting division structure: one main icon of the department and elegant lines connecting each section (or project) with space for a longer description of each company section.
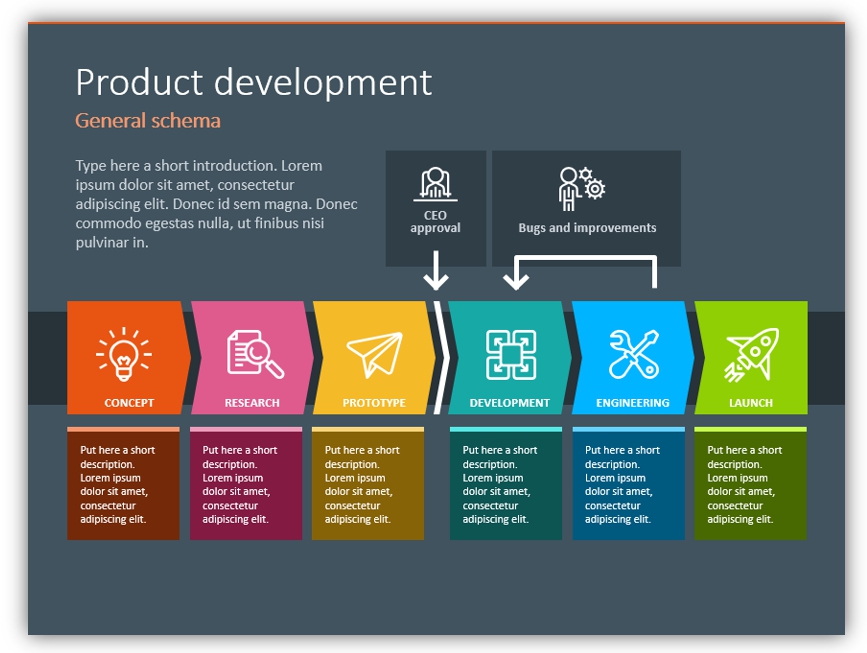
- product development process: flow chart of a product development illustrated with icons and comments/notes above on the dark background. Specific person positions can be placed above the process, to show who’s involved in monitoring or decision-making points.
- team introductory slide: to be used when presenting your management board or project team. Each person is assigned a symbol, corresponding to his/her position; plus we used different colors over pictures to make a slide more vivid.

For more inspiration, subscribe to our YouTube channel:
Resources: Company Roles & Department Structure PPT Graphics
If you like the examples above, you can download the whole package we designed (or subscribe and get slides every month for your needs).
Should you need help with choosing or using the PowerPoint graphics, let us know here. We will gladly help.


