Pillar Diagrams as a tool for Presenting Solid Foundations
Using pillar or so-called column visuals helps to express business concepts such as company strategy and values that are based on building something on a solid foundation and principles. Adding a slide with a pillar diagrams chart rather than using only text bullet points will help you to present your idea in a clear visual way. Check below several pillar diagram design examples we created.
Explore our Business Performance PPT Reports category on the website for more resources to boost your presentation impact.
What are the Pillar diagrams? A visual framework representing a solid common ground and supporting principles in the form of vertical columns standing on common foundations supporting the roof – a symbol of a joint goal or objective.
Source note: All slide examples here are based on Pillar Diagrams and Column Infographics collection.
Ways of Pillar Diagram Design
Below you’ll see our ideas for creating pillar diagrams. By clicking any picture you can see the full set and get additional details. If you have other ideas or suggestions, feel free to share them in the comments 🙂
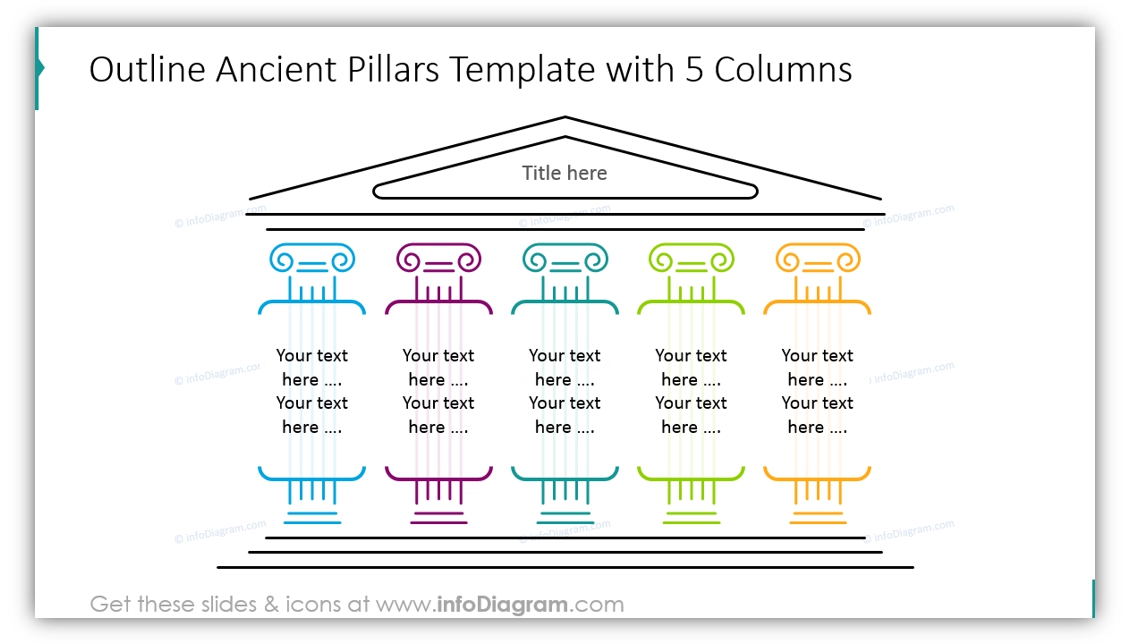
#1: Outline Ancient Pillars
Such a minimalistic diagram style will suit any presentation. Outline style is a rising graphical trend, and it will make your slides look stylish and simple at the same time.
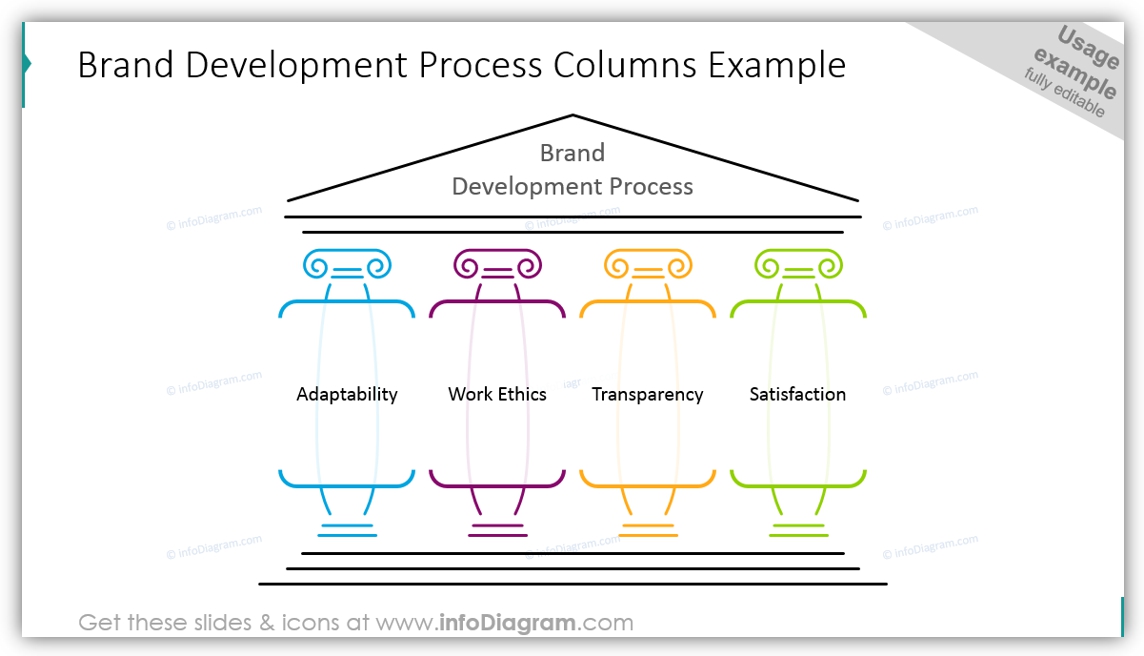
On the next slide, you can see the example of using such outline columns (we made them a little bigger so all words would fit. You can tailor the diagrams to your taste as well):
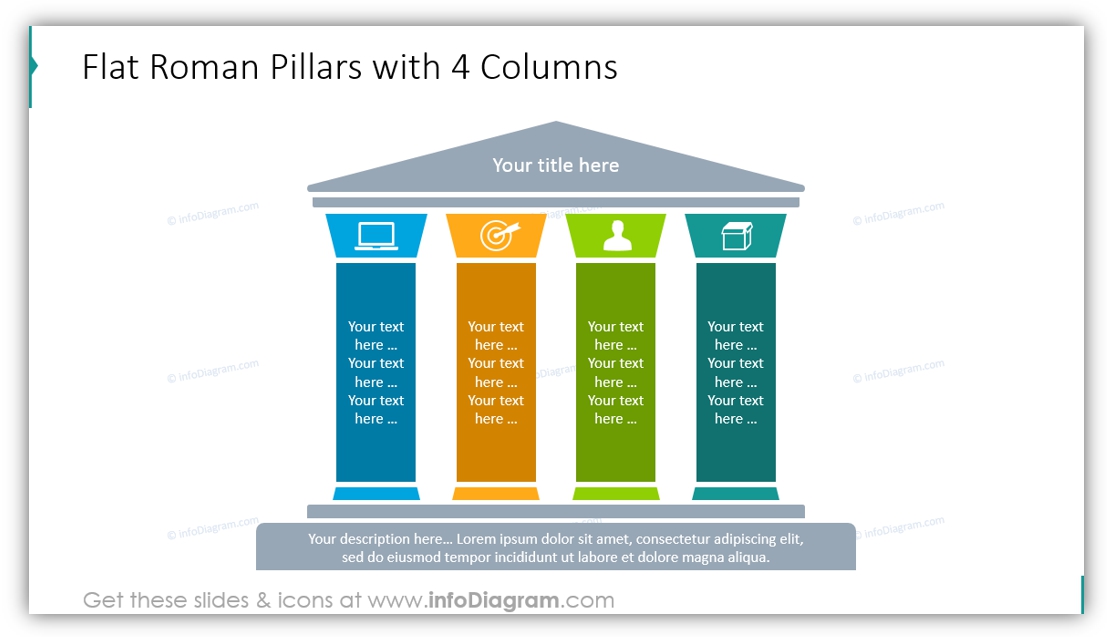
#2: Solid Color Roman Pillars
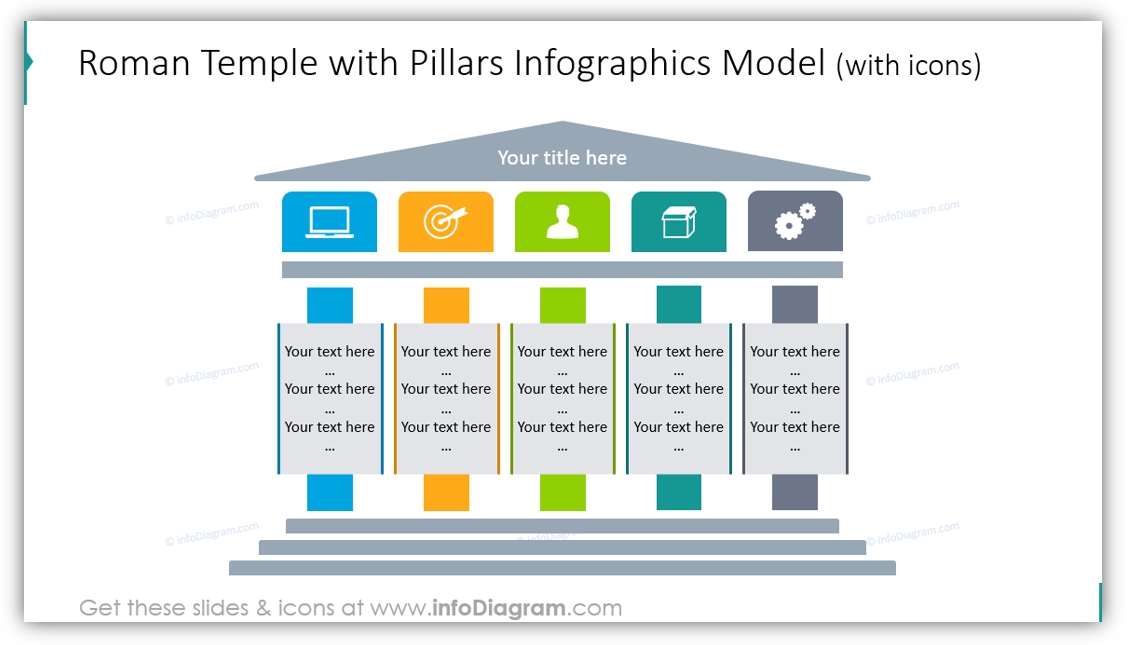
Flat is suitable for any presentation style. We colored pillars in different colors and illustrated each with an icon so that you can avoid additional texts, as symbols are a universal language.
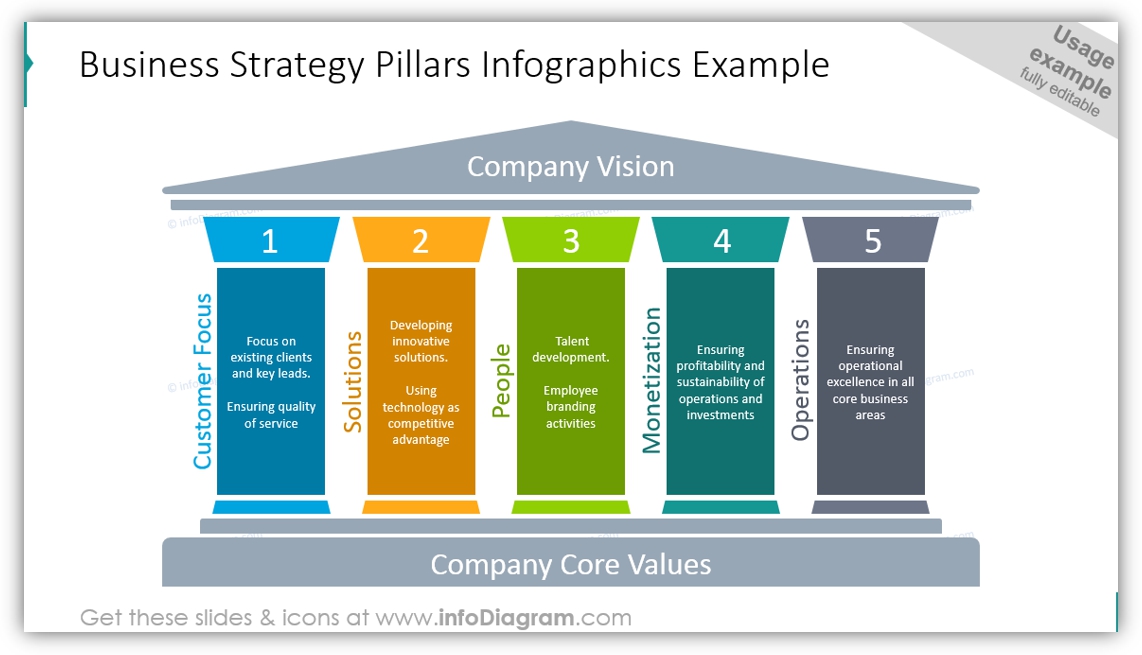
For example, the illustration we used to visualize the concept of Business strategy has the company vision statement on the top, its core values as the foundation, and five major components supporting the company mission:
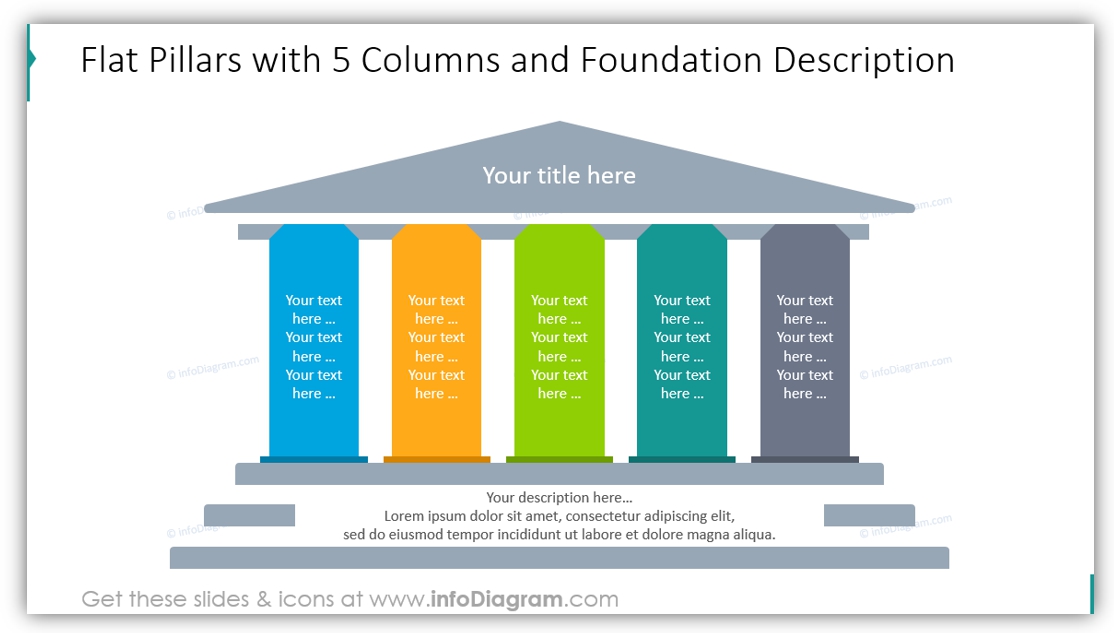
#3: Simple Pillar Diagram Design with Foundation Description
If you need to put more details in the bottom part of the pillar graphics, here’s a template for that: five flat pillars of various colors placed on the staircase basement where you can place all texts needed.
#4: Pillars with Header Infographics
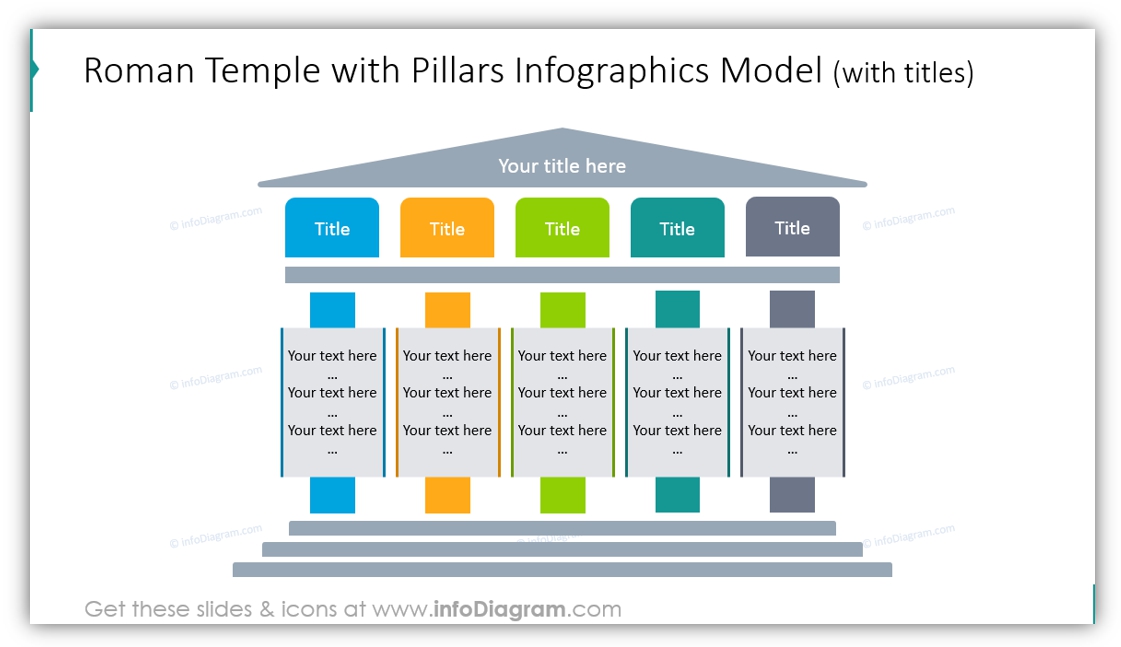
On the other side, if you want to focus on pillars and put more text on them, you can use the diagram template below with pillar header icons to illustrate each column.
Pillar Diagrams are a great metaphor
What do you think about the proposed slide graphics? With a bit of creativity and some design rules, it’s possible to make a structure resembling the concept of Roman pillars.
Having such pillar graphics made of vector shapes, you can easily add or remove columns to fit the number you need.
To keep your slide look professional don’t forget to do a final check, especially:
- are all pillars equally distributed? Are all elements centrally aligned?
- aren’t they stuck together? There should be a wide enough gap between them.
- the basement should be wide enough for graphics to look stable and solid
- top triangle should be not too thin.
- The text inside the pillar diagrams should have enough margins from the textbox edge.
Check our video guide on how to redesign pillar diagram step by step:
Resources: Pillar Diagrams & Column Infographics
We hope you found some inspiration for creating pillar diagrams in our article:) You can recreate the pillars for the slides from our examples or get ready-to-use PPT slides.
If you like the designs above, you can get the package we created (or subscribe and get slides every month for your needs).
Should you need any assistance with choosing or using the PowerPoint graphics, let us know here. We will gladly help.


