5 Ways to Present Causes & Effects: Ishikawa Fishbone
Working on a problem-solving presentation? In this blog, we are presenting 5 examples of how you can use the cause and effect diagram to analyze a business challenge or problems of various kinds.
See how you can easily show to your audience the discussed problem broken into causes and roots.
Elevate your business performance presentations with our curated resources – visit our financial performance PPT reports webpage
The visualization we present is a causal diagram created by Kaoru Ishikawa and this framework is commonly used in product design and quality defect prevention. Even though originally the Fishbone Cause and Effect diagram was developed for quality control, you can use it also in a wider business context, for instance:
- discovering the root cause of any examined technical or soft-skills challenge
- uncovering bottlenecks in your company processes
- identifying where and why a certain process isn’t working
Furthermore, this tool can be used as a brainstorming technique for problem-solving in order to find the underlying roots of observed problems.
Check five ideas of how you can visualize the fishbone chart to use it for any purpose we listed above.
Note: All presented slides can be found in the Cause & Effect Fishbone PowerPoint Diagrams.
Modern presentation of Cause & Effect Diagram (Ishikawa Fishbone)
See how this Fishbone diagram can be visualized, applying a modern flat infographics style along with a flat icon set. You can see the full collection by clicking on any picture.
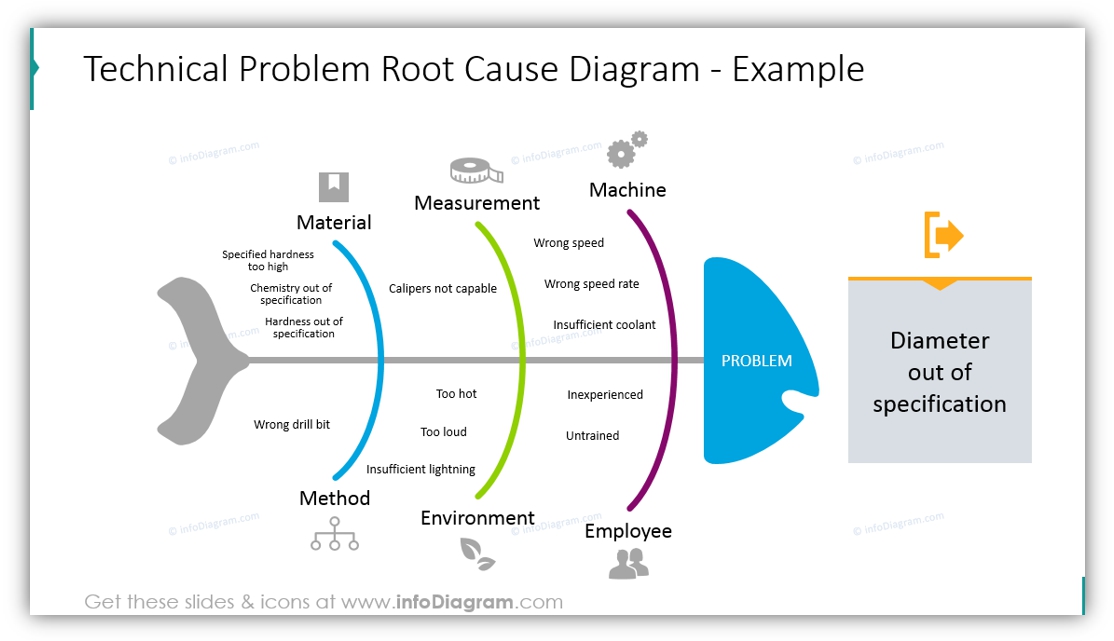
#1: Different-colored branches of Fishbone
Such a simple outline diagram is style neutral and will suit any presentation. We appointed a different color to each ‘bone’ and illustrated them with icons. This is the classic example of a cause and effect diagram – technical problem root chart:
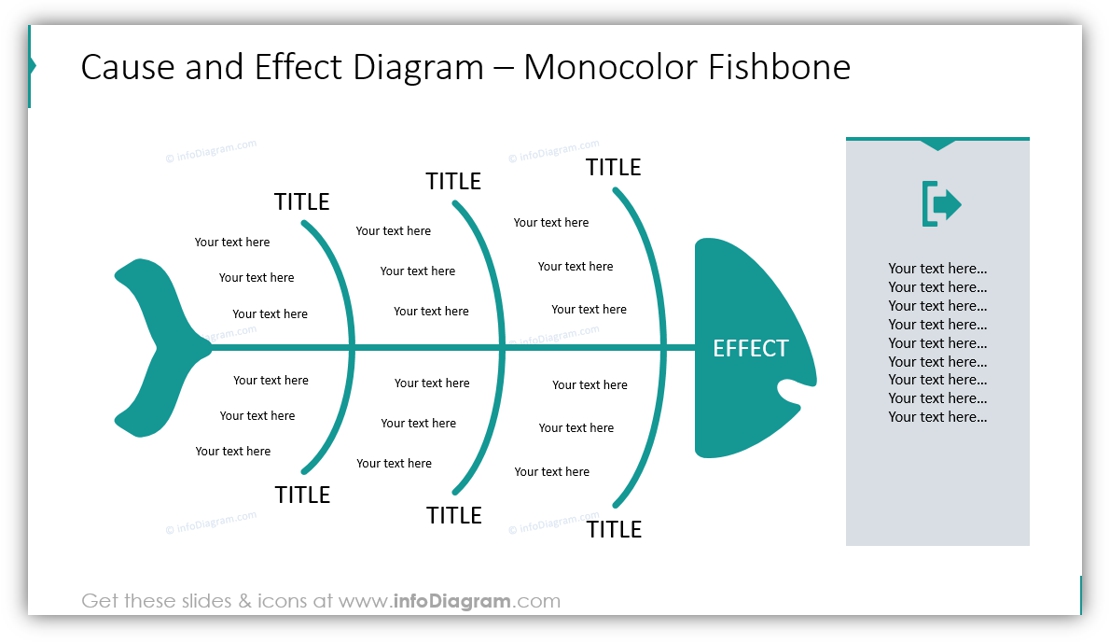
#2: Monocolor Fishbone Template
If you prefer a more decent look, consider mono-color diagrams. This will work for you also if you have rigid corporate restrictions, you can use one color for the whole diagram (the turquoise outline can be modified to any other color that will fit your branding).
#3: Input-Output Ishikawa Diagram
When you are visualizing product development or design process, a cause and effect diagram can serve as a good tool. All shapes are placed in such a way that a white arrow is clearly visible, so for the listener, it will be easier to perceive the information, despite a lot of data on a slide. We put a title for each bone and two icons at the beginning and end of the chart.
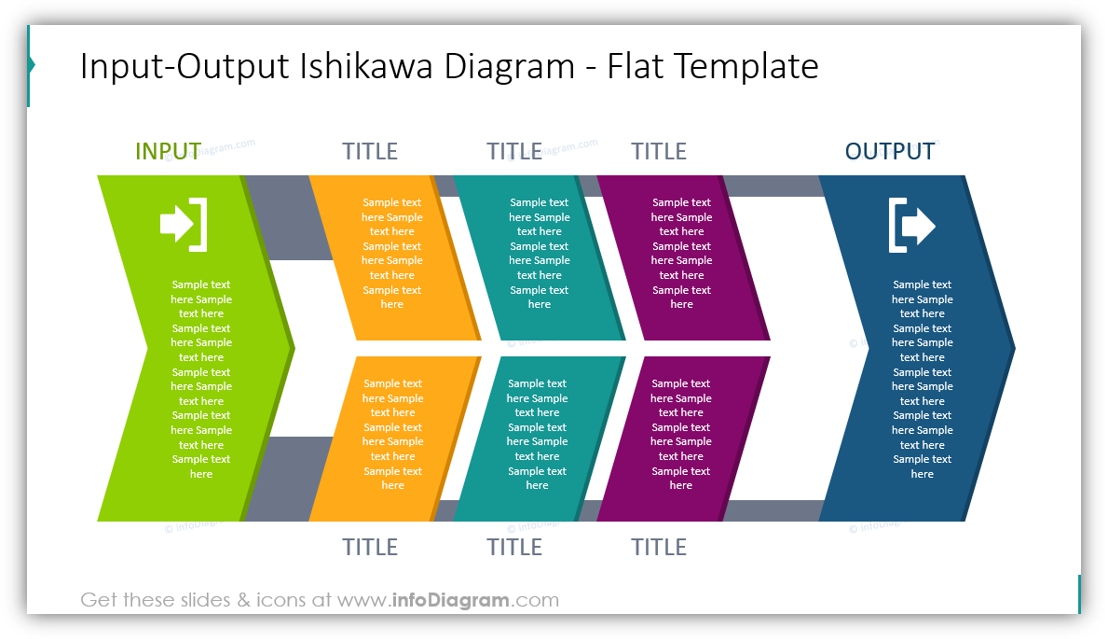
Notice the shape of the fishbone inside? Look at the white gaps :).
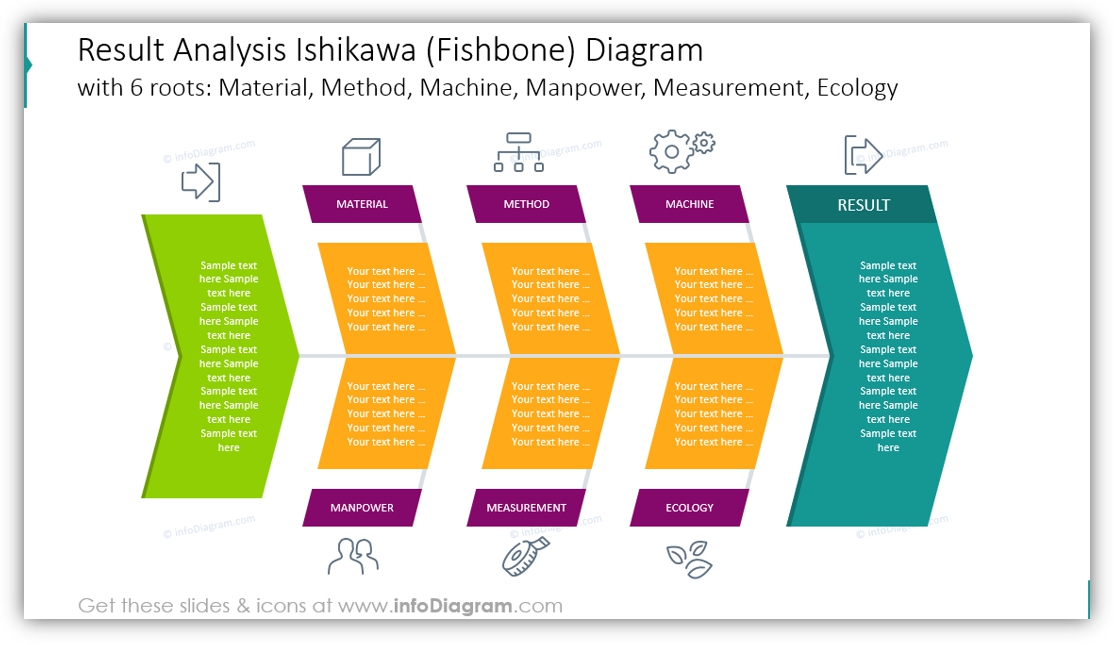
#4: Result Analysis Ishikawa Diagram
You can visually show the causes and a result of a process using the Ishikawa diagram. We placed symbols near each root and applied different colors on three parts of the chart.
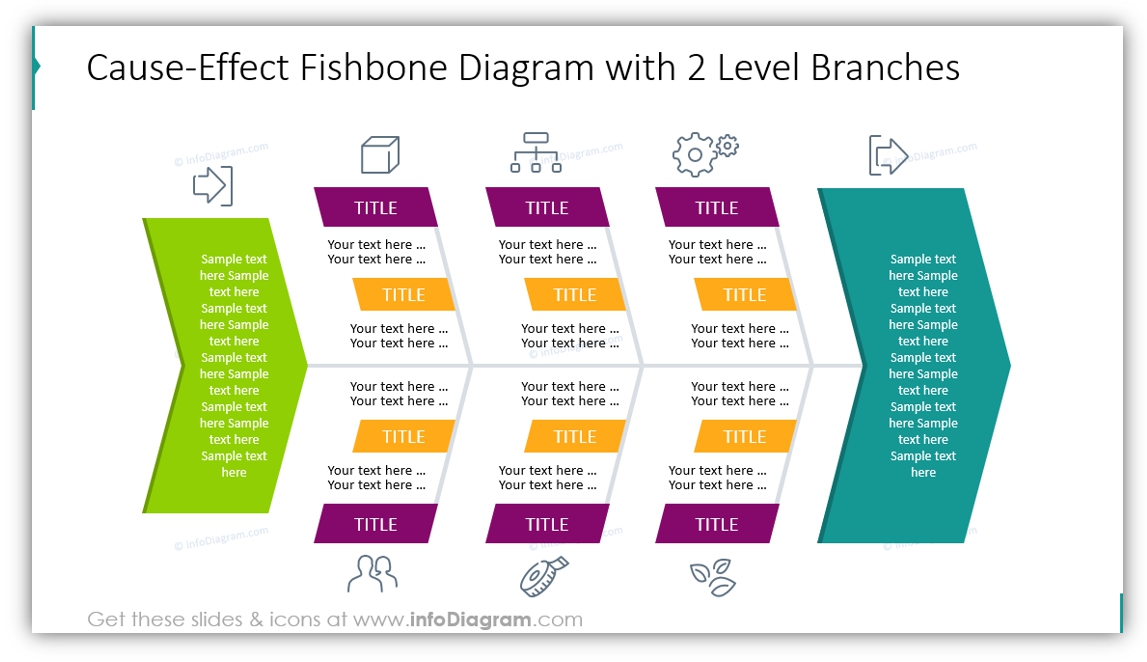
#5: Fishbone Diagram with 2-Level Branches
If you need to put several concepts on one bone, a good idea is to create two levels: six roots are definitely better than 12. A quick piece of advice: choose the keywords to eliminate the amount of text and focus attention on the most important points.
Why Fishbone Diagram to Present Effects & Causes?
If the slide pictures were not persuasive enough, consider the advantages to using Fishbone infographics in your presentation:
- easy to perceive a larger amount of information thanks to the structured way of presenting the problem causes
- possibility to explain complex concepts with one main image
- you can break the diagram into several parts by assigning icons or colors like we did with fishbones
- using modern yet simple graphics, your slide will look professional, and people will be amazed by your presentation 🙂
Explore our YouTube channel for more creative inspiration:
Resources: Ishikawa Fishbone Diagrams
We hope our blog was inspirational for you 🙂 You can use the ideas and try to recreate such diagrams from the examples above or download ready-to-use PPT slides.
If you like the slides above, you can get the fishbone collection here (or subscribe and get slides every month for your needs).
Should you need help with choosing or using the PowerPoint graphics, let us know here. We will gladly assist you.


