Present Decision-making Process Creatively With a Decision Tree Diagram
Need to present a business decision process, illustrate a legal procedure, or show the decision logic in an expert system answering human questions?
Elevate your business performance presentations with our curated resources – visit our financial performance PPT reports webpage.
Consider using a decision tree diagram in your presentation to express visually your decision flow. See examples we’ve collected on how you can illustrate decision-making with creative flowcharts.
Note: All example images below can be found in the collection Decision Tree Diagrams Collection PPT Template (see details by clicking the pictures).
Why use tree diagrams to present decision flow?
Using tree diagram visuals helps to express your decision flow clearly. Therefore it becomes much easier to understand. The human brain processes visual information faster than text or verbal one.
Drawing such a decision diagram is not a complex thing to do. It also gives you the freedom to easily modify decision flow, add explanations, or illustrate specific decision points.
What is a decision tree diagram?
A decision tree diagram is any visual representation of the decision-making process. You start from the root node (usually the very top one, in the case of a horizontal tree diagram) and you continue to illustrate potential decision-making points by tree branches.
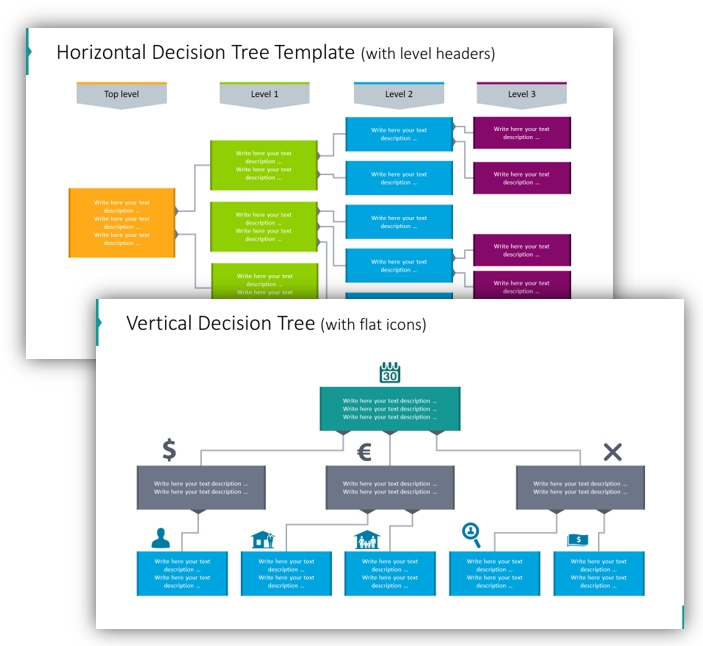
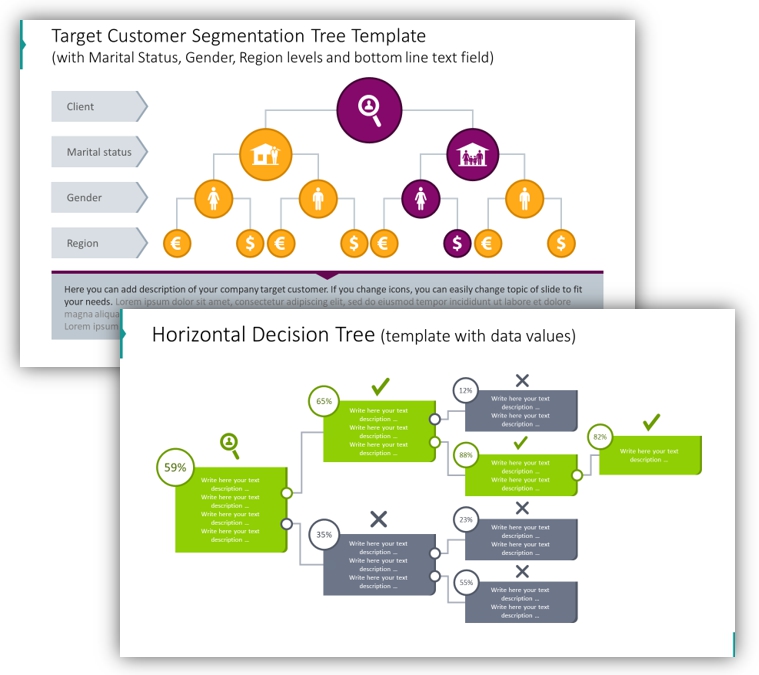
Each branch is assigned a decision attribute e.g. discrete states such as Yes / No questions, Married / Single marital status, or Occupation type. Decision criteria can be also a numerical value (age, score, fraud likelihood, risk level).
The tree finished with the final state – leaving with no sub-branches. Such end-decision class represents an Approved / Rejected statement in a credit scoring context or other types of actions.
Examples of decision processes creative visualizations
Flat graphics Client Grouping Tree
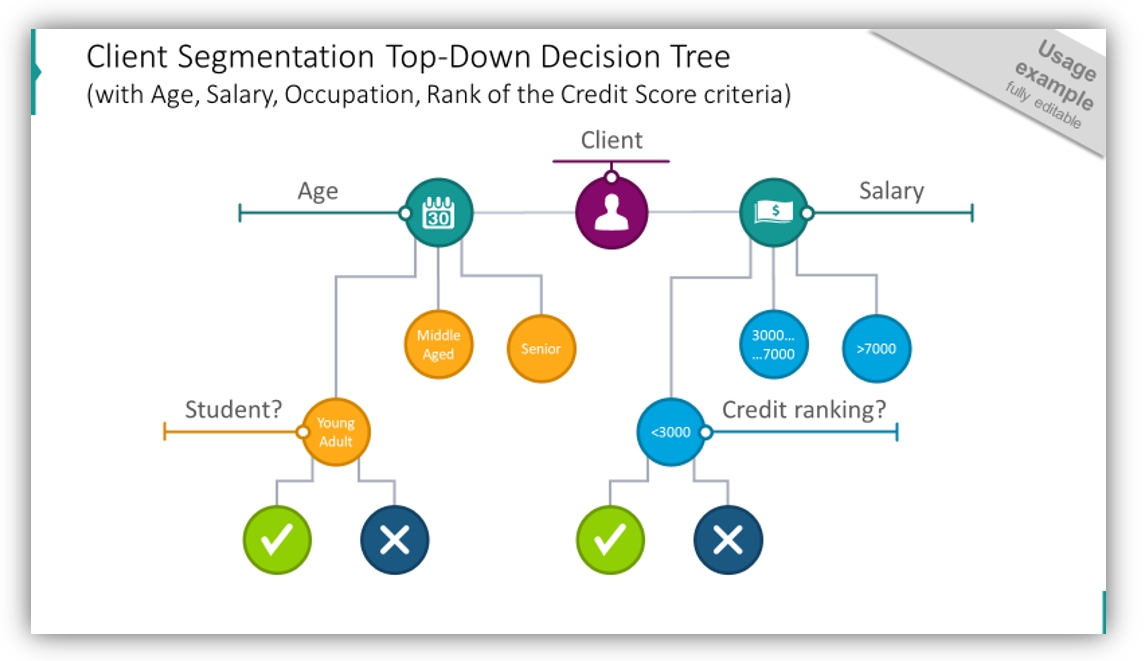
To illustrate financial credit application evaluation we created a simple and modern flat design.
You can rather easily try to recreate a similar tree using basic PowerPoint shapes with some little graphical additions (such as contours and icons). The key to keeping the professional look of the diagram is to remember the alignment of all shapes and don’t stuff too much inside the slide. Have enough whitespace around nodes and the whole tree diagram.
Creative Sketched Customer Segmentation Tree
We created a decision tree explaining how a company creates customer sub-segments based on customer demographics data such as marital status, gender, and family size. Such segmentation helps to address specific client groups better with more appropriate products or marketing messages.
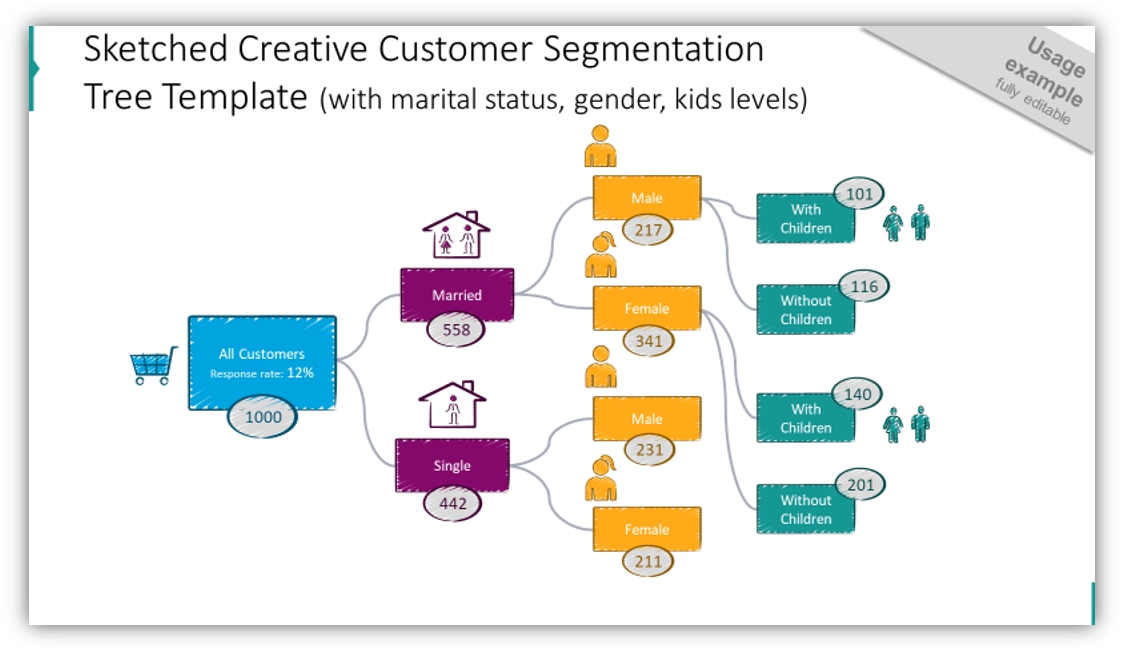
To give it a creative look, we used hand-drawn shapes for tree notes and arrows. Additionally, we used color coding for each decision level and added scribble icons to improve the readability of the whole decision chart.
Similar decision trees are used for classification tasks in analytical processing and Machine Learning algorithms.
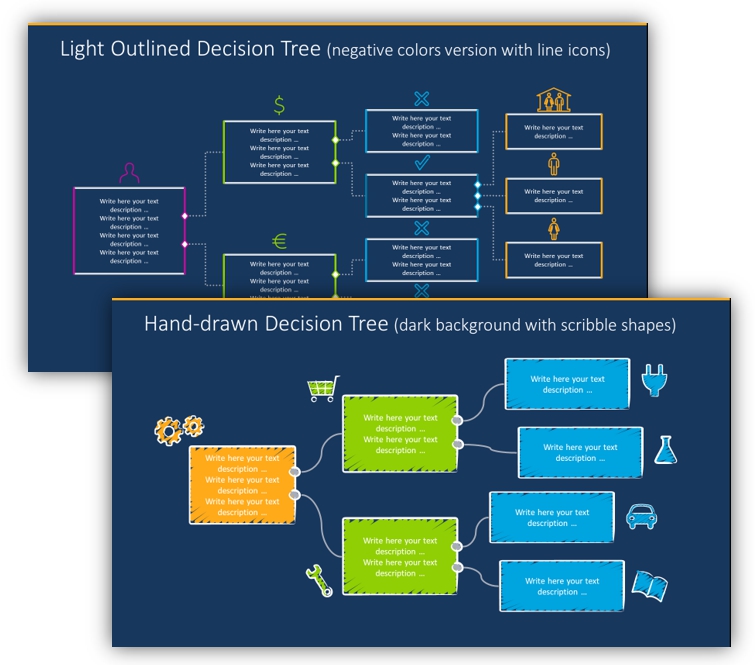
Surprise the audience with negative color slides
To make your decision chart stand out, consider using a dark background and white tree diagrams, as below.
Check our video guide on how to redesign Decision Tree step by step:
Resources: Decision Trees Graphics for PowerPoint
To help you design such diagrams either in creative style or modern simple flat graphics, we have created a collection of editable Tree Diagrams for PPT Graphics. You can find there a dozen diagram charts, creative shapes, and symbols to illustrate decision attributes.
If you need to extend the symbols set, check the wider Flat Icons Library with over 380 creative symbols.


