Illustrate Strategies with Milestones by Curved Roadmap PPT
Looking for a way to illustrate a plan, journey, or steps and milestones? With the approaching new year, this topic is especially relevant now 🙂
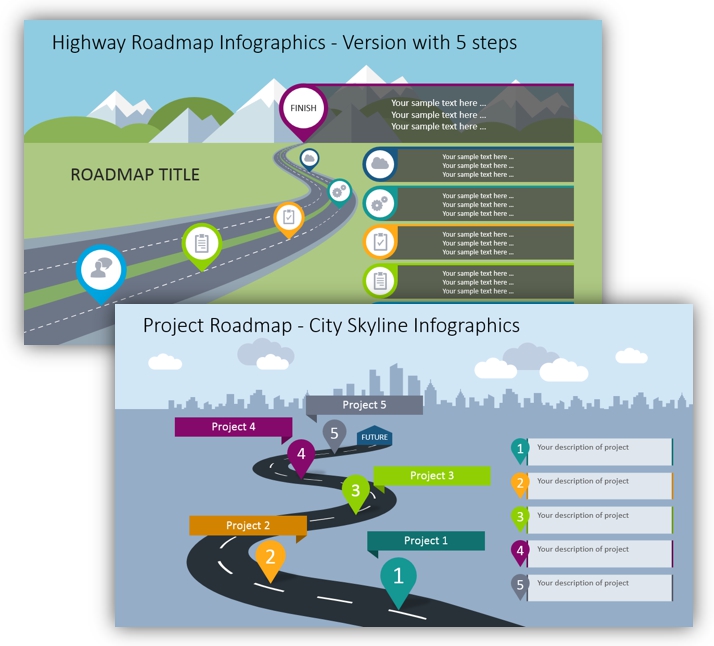
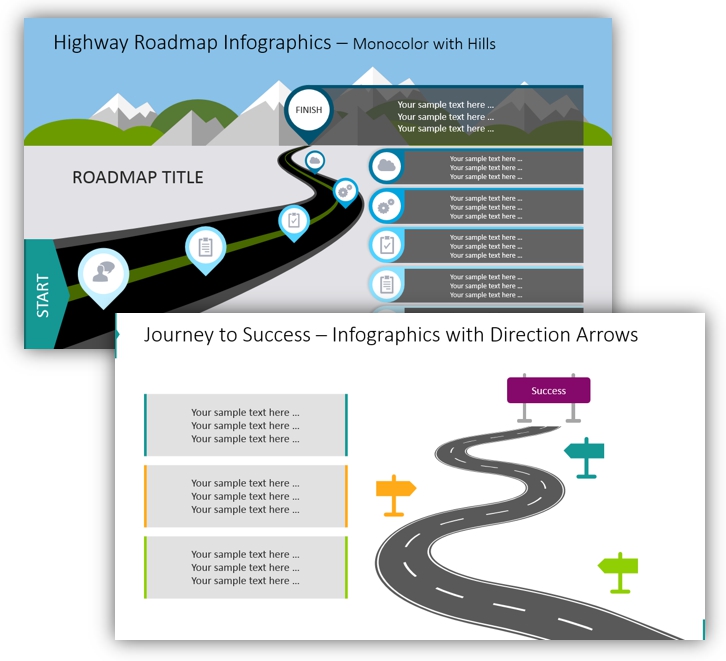
The visual metaphor of 3d like the winding road is a great way to show the journey line to the customer or personal success. In strategy and management context, you can present a curved roadmap as a path toward company vision or activities review timeline.
You can get all the icons and slides from Curved Road Map Presentation Infographics collection (see details by clicking the pictures).
Why use curved roadmap diagrams to show milestones?
Such a curved roadmap is a great way to show the strategy flow and action steps. You can easily alter their number and it will look much better than bullet points.
You can also add simple animations to uncover items on a journey map one by one. Each item can be illustrated by an icon specific to the roadmap milestone so you will create a better association with the presented topics. If you are missing any symbols check to see the Related Diagrams section for PPT icons collection.
We added there set of textboxes to explain each roadmap step. Feel free to extend those shapes if you need more space, or duplicate them to get create more roadmap steps.
What is a curved roadmap diagram?
A curved roadmap is a graphical form illustrating various plans and steps using the metaphor of a road to visualize the process or a journey toward the goal.

Usually, there are up to five steps on each roadmap. You can remove or add them, but remember not to stuff too much information into one slide. Better to break it into two or more.

There is plenty of space for the notes on each of the pictures above. Another variation is a slide with a white background, which also looks attractive. You can use numbers or icons to illustrate each step, depending on what you are talking about.
Creative Curved Roadmap graphical examples
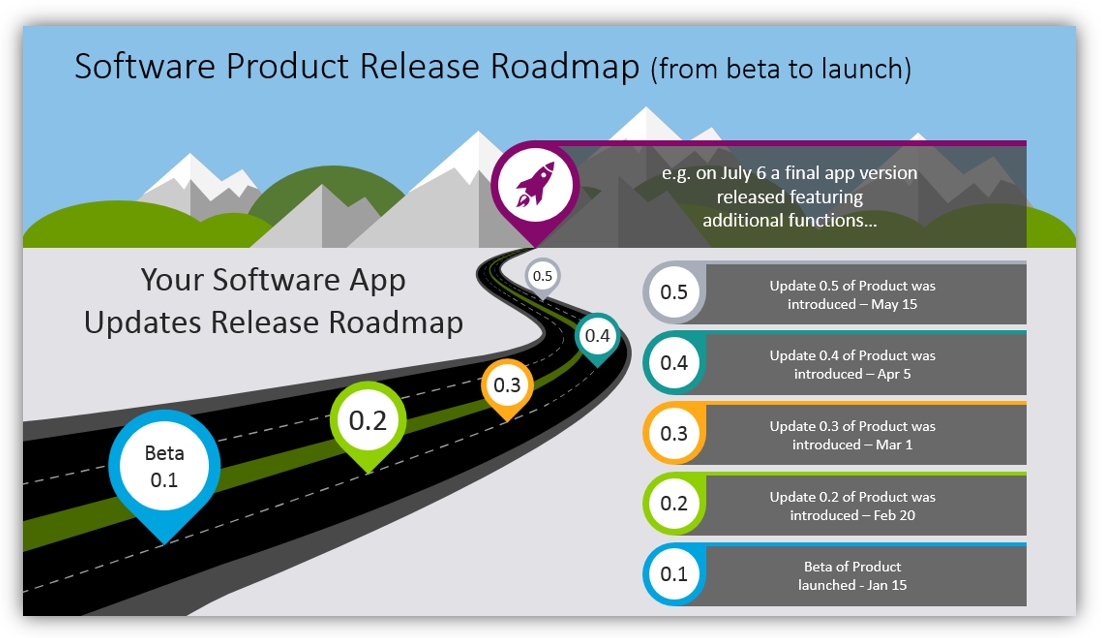
Software Product Release Roadmap
To present a software release we designed such a chart with five steps. In the right corner put all the descriptions: the final release version, which is illustrated with the rocket icons and each step – with different-colored outlines.

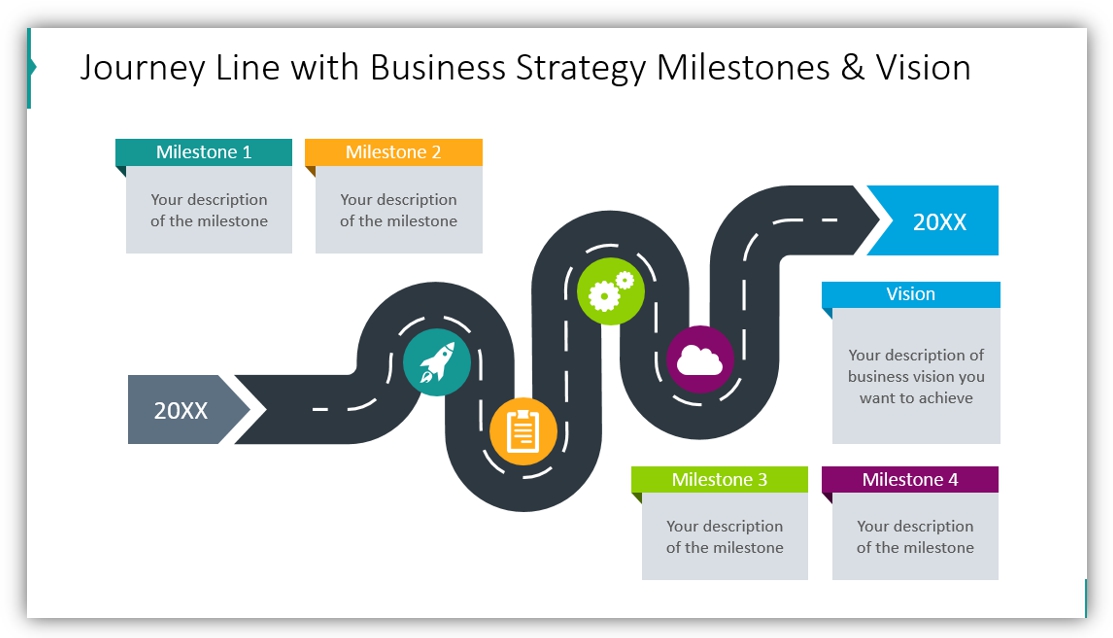
Business Strategy Milestones & Vision Journey Line
You can use also a flat roadmap and present milestones horizontally. There are start and end points, which are highlighted with colors. There are notes for the steps around the illustrative road.

To improve the readability of our curved roadmap diagrams, we added flat or outline icons. You can also spot we used different colors for steps to better and faster slide understanding.
Resources: Curved Roadmap Infographics for PowerPoint
To help you design such infographics for strategy or product release presentations, we have created a collection of editable Curved Roadmap Presentation Infographics. You can find there a dozen diagram charts, usage example, and symbols to illustrate decision attributes.
If you are looking for other diagrams, check out our infographics bundle which includes creative PowerPoint 200+ diagrams, including timelines, lists and comparisons.


