How to Create Growth Diagram in PowerPoint
At the end of the year, we’re all reporting. It may be not such a pleasant process, but let’s be strong 🙂 We usually talk about growth or decline in certain spheres. Today I’ll show you how to quickly design a growth diagram in PowerPoint.
Elevate your business performance presentations with our curated resources – visit our financial performance PPT reports webpage.
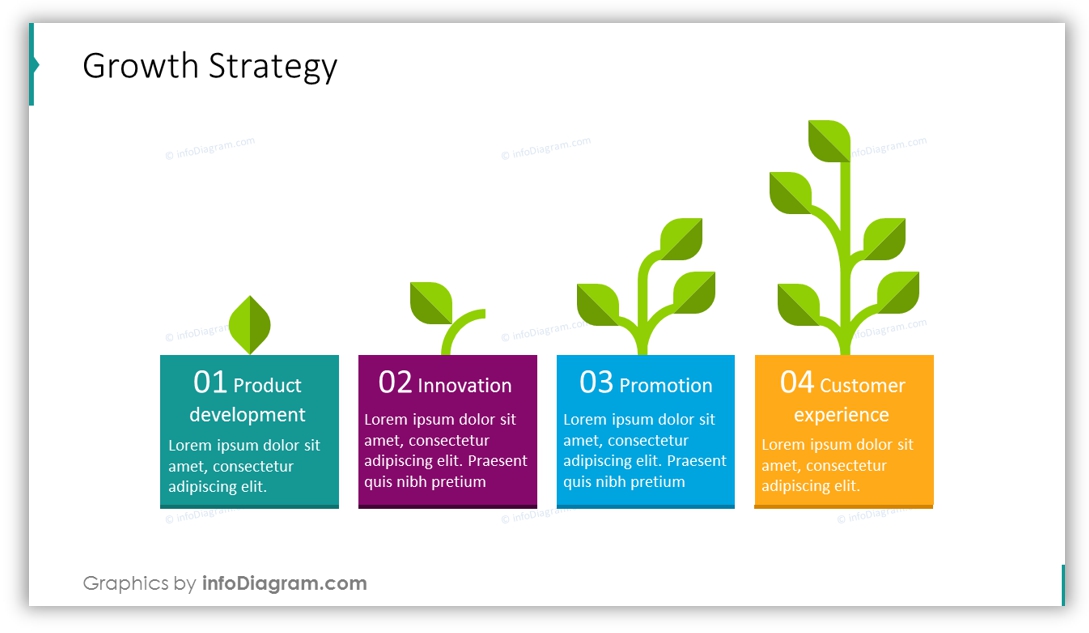
There are many ways you can visually present this topic, but growing a plant or tree is one of the simplest and strongest metaphors.
Here’s what your growth strategy or analysis can look like (before and after example):
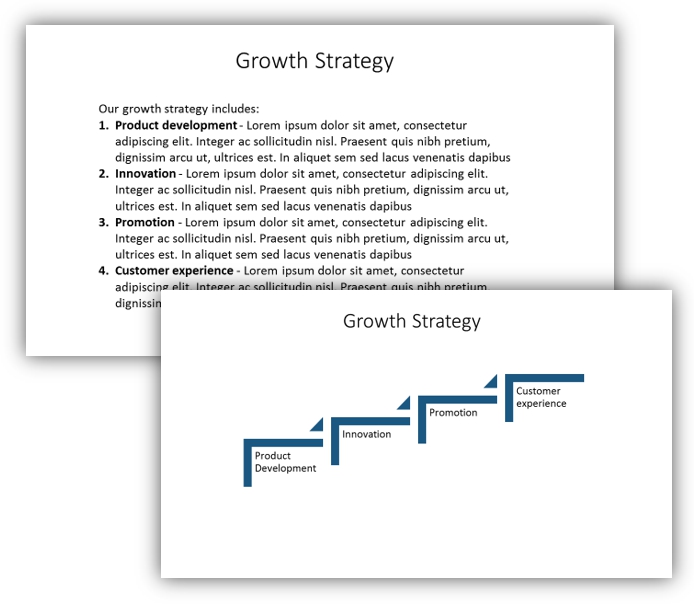
In the pictures above you can see a before the slide with text-heavy slides or default looking smart. But you can replace them quickly with modern graphics that are more eye-catching.
You can get all the icons and slides from the Business Growth & Development Template.
If you want to find out a quick way how to beautify your slide and don’t invest a ton of time into it, here’s a step-by-step instruction on how to design such a growth chart.
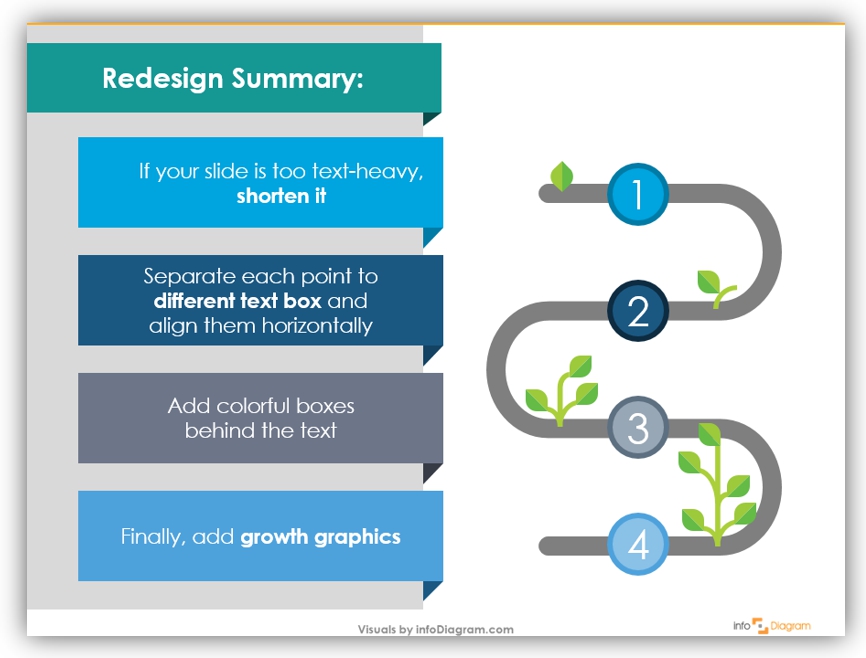
1. If your slide is too text-heavy, shorten the text
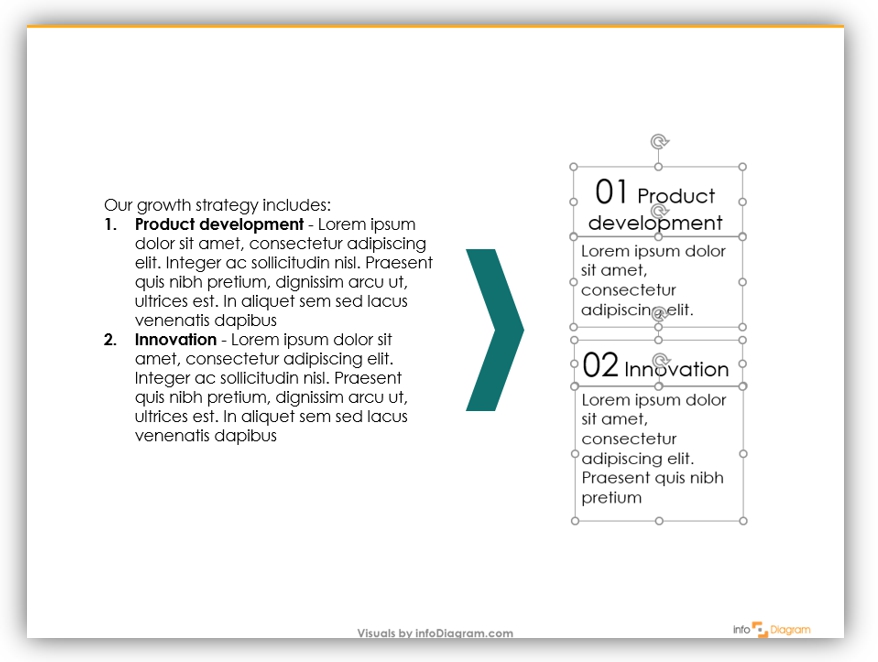
Here are four practical tips on how to make your text shorter:
- leave only keywords, remove filler text
- split numbering from the rest of the text
- separate the title of the text
- if you still feel a need to include more text, better split the slides
2. Separate each point into a different text box and align them
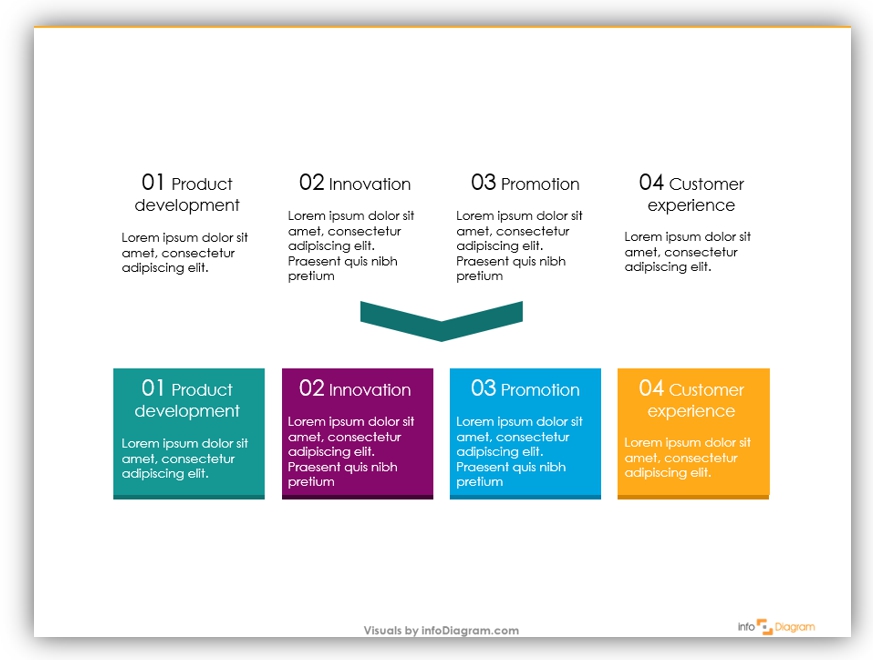
Align text horizontally (using PowerPoint select the shapes, and then Format tab, and there in Align menu click ‘Distribute Horizontally’).
A good idea is to add colorful rectangles (or another shape you prefer) behind the text and change the text color to white. Add darker lines at the bottom as a small graphic detail to make it look professional.
3. Add growth graphics
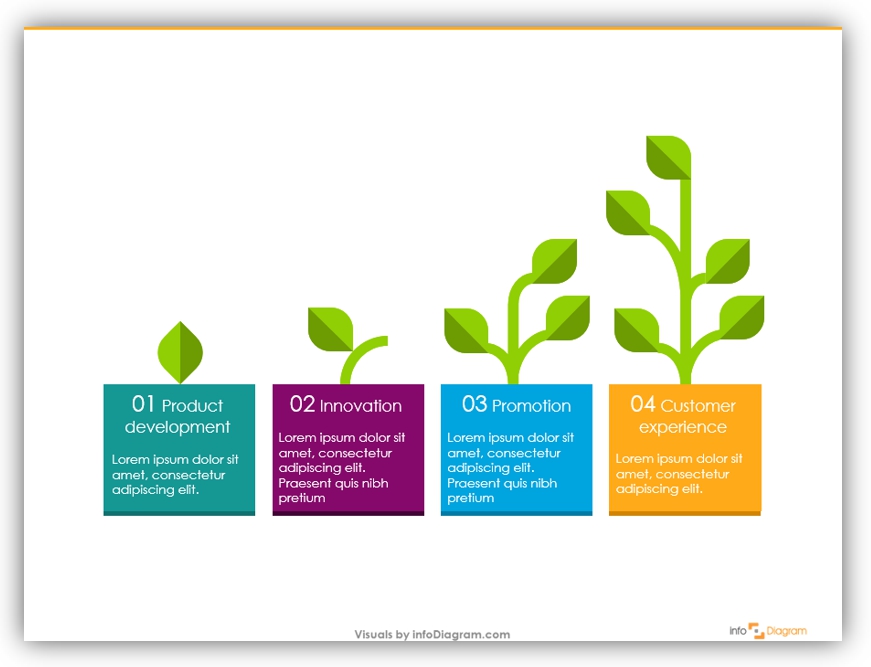
As a final step, add graphics of plants at various stages of growth to illustrate the slide message.
Why add graphics at all? They help your audience get a sense of what you are gonna talk about much quicker and you don’t have to waste precious speech time on explaining what you want to show on each slide. Looking at the example above it’s clear at first glance that it’s a growth metaphor.
Growth Chart Redesign Summary:
Now I’m gonna tell you a secret: this chart can serve you to show a decline as well.
All you have to do is to put the biggest plant in the first place and gradually decrease it. That’s why editable graphics are so powerful.
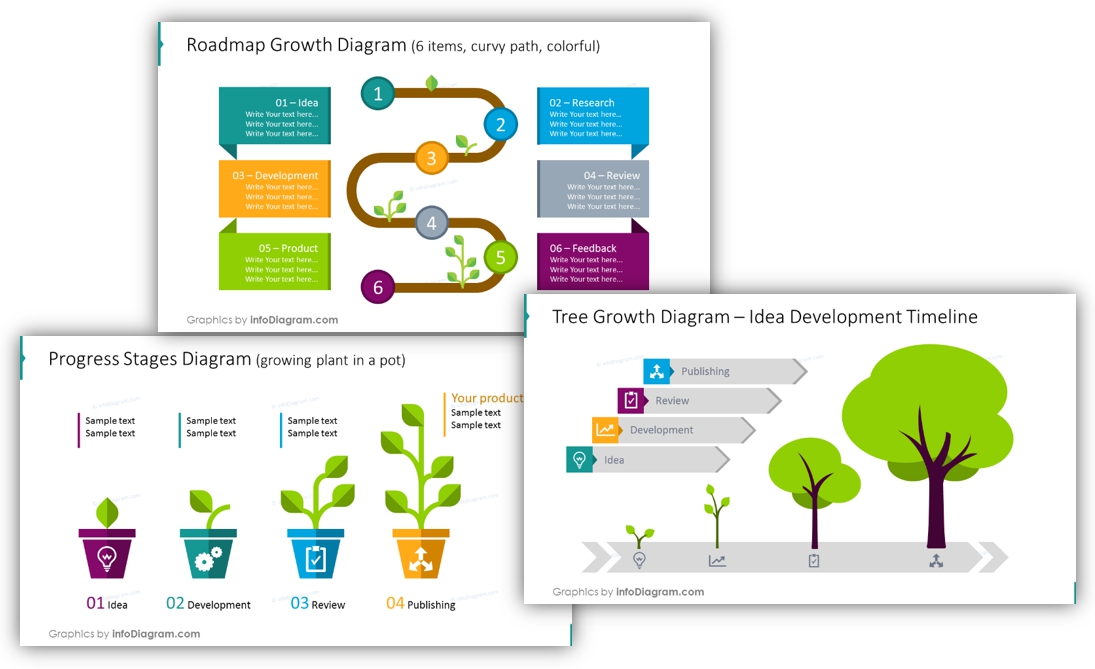
Here are some more examples of how you can illustrate a growth strategy or concept:
For more inspiration, subscribe to our YouTube channel:
Resources: Business Growth & Development Template
If you like the examples above, you can create your growth diagram like our examples or download the whole package we designed (or subscribe and get slides every month for your needs).
Should you need help with choosing or using the PowerPoint graphics, let us know here. We will gladly help.


