Making Creative Mind Map Presentations
Developing and sharing ideas, complex ones can be difficult. When presenting it to other people you should take care that the idea will be understood clearly, as well to ensure it will be engaging. Using the mind map method helps to solve both of those issues.
Elevate your business performance presentations with our curated resources – visit our financial performance PPT reports webpage.
How you can creatively present mind maps?
The most interactive way is to draw a mind map on paper. However, if you want to share them with a bigger audience or share further, then it’s better to use some presentation software app for that. Why not use the one you probably have and are familiar with – good old PowerPoint :).
Regardless of what stage you are at in the development or planning process, you can use different mindmap graphics to help your audience understand. Your presentations won’t be boring with colorful, interesting PowerPoint graphics.
All example images below can be found in the Creative & Simple Mind Map PPT Diagrams slide deck (see details by clicking the pictures).
How can you use mind map diagrams to help your presentations? Here are a few simple ways.
Use a freehand style mind map diagram slide
To make your illustration look unique and personal, consider using hand-drawn style graphics like the one below.
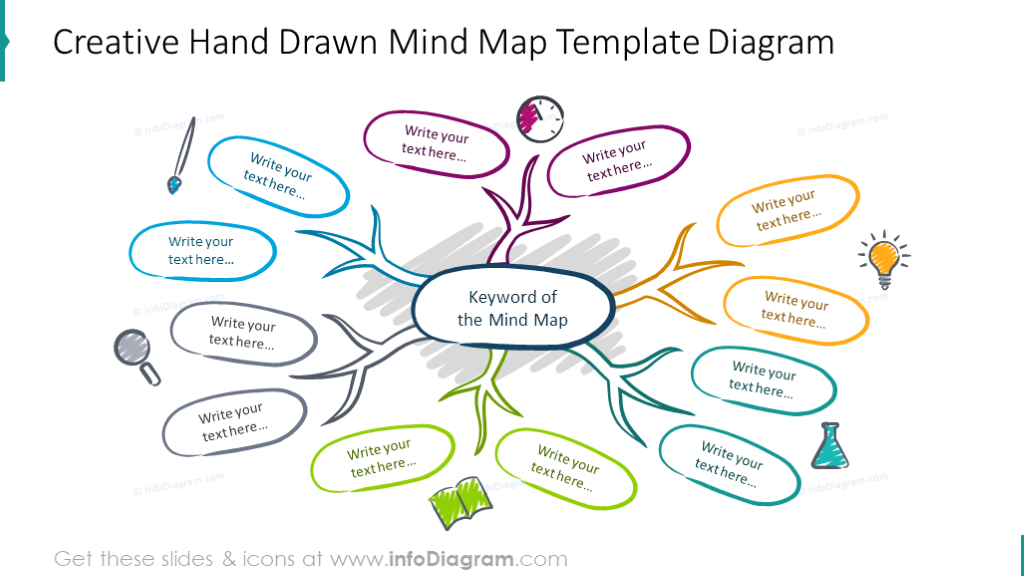
You can use the mind map diagram template we’ve designed. They are versatile and there are several different styles to choose from. This mindmap is drawn in a “freehand” style which adds creative flair to any presentation. The colors can all be changed and customized, as can the text.
Present your business plan using a mind map
Struggling to find a compelling way to share your business plan with your team or potential investors? Use a mind map as your guide! Show your audience how different departments and areas of your company come together and collaborate, while also highlighting the important role that your strategies and ideas play.
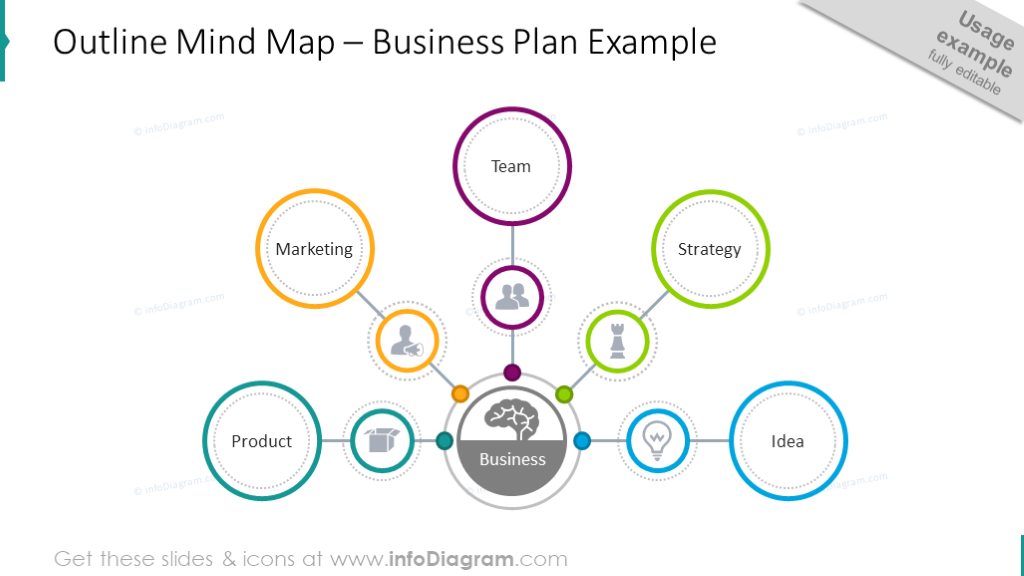
Share every detail with a multi-branch mind map
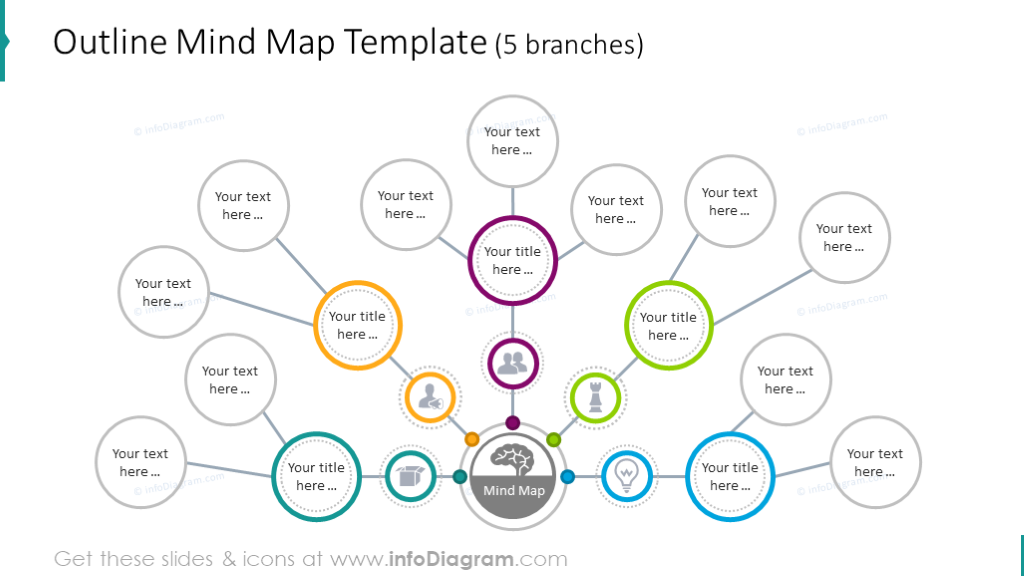
This particular example has five branches. You can extrapolate on different points and areas of focus with additional “branches” or “arms” to help paint a complete picture for your audience.
Explain mind map with head infographics
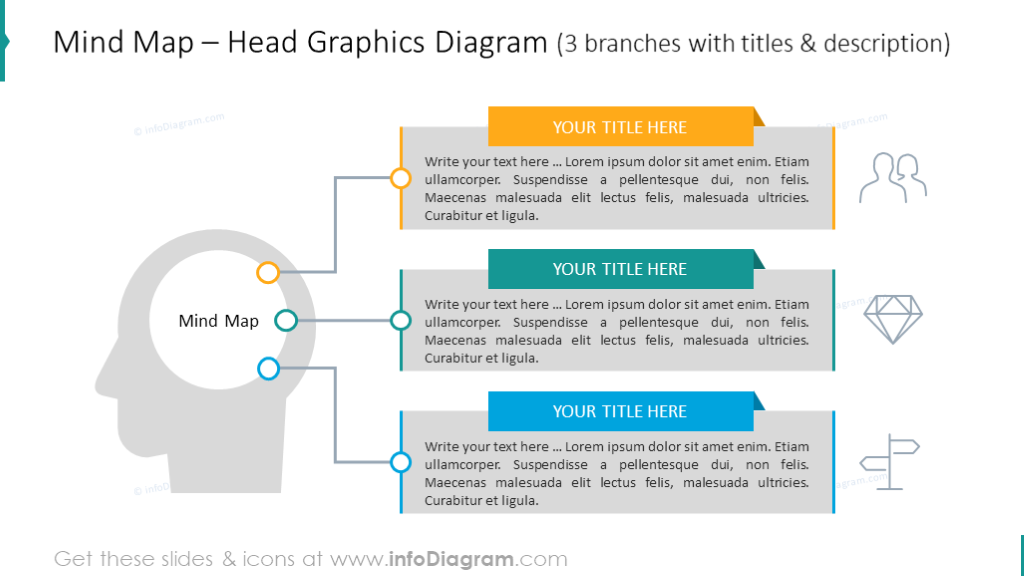
If you’d like to provide more detail on fewer points, consider the head graphics diagram. The head graphics are a direct visual metaphor for a mind map. It shows clearly that you’re dealing with matters of thinking and creation.
Adding a few icons to each item creates a better visual association. As in the case below, where we added a people symbol for a human resources item, a diamond for business value, and an arrow sign for strategy selection or planning.
Present an idea analysis creatively
You can visually visualize an idea analysis, using light outlined illustration, like on the slide below. Break down your concept by branching off into specific sub-topics.
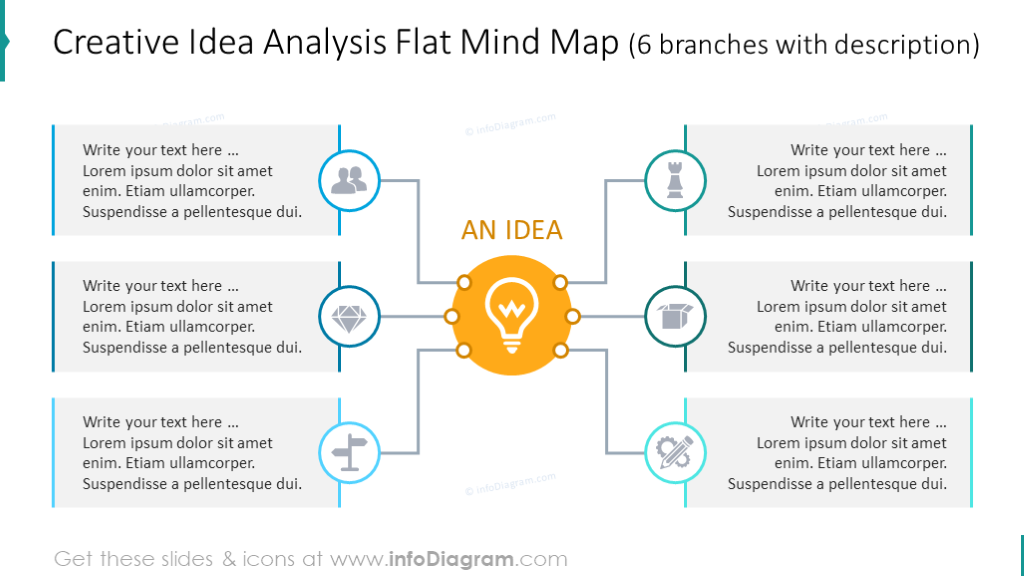
To make such a presentation slide more outstanding, consider adding placing the full slide-size photograph in the background.
Leverage the power and flexibility of visuals
Regardless of whether you use these or other forms when working with a mind map, make full use of visual representation. Adding colors, and illustrative symbols support the power of the mind mapping approach, whether sketching on paper, presenting on the flipchart, or working in presentation software.
If you will go for a digital presentation e.g. in PowerPoint, use the benefits of vector graphics. Having editable shapes, you can always adapt your diagrams to suit your needs. You can place your text and different aspects of the diagram anywhere you would like. You can add or remove text as you need. You can add or remove icons and even change the color. The outline style icons even allow you to select the outline color and thickness so that everything will look exactly how you’d like it to.
Explore our YouTube channel for more creative inspiration:
Resources for mind map illustrations
To help you creatively present or share your mind map structures, we have designed the mind map visuals template. These PowerPoint graphics can all be modified to fit your presentation topic.
The graphics are offered in three distinctly different creative graphical styles so you may choose the design which suits you and your audience. For printable mind maps, you can use in worksheets or notes for your attendees, we suggest using outlined shapes. If you’re only going to present on a screen, then using a dark background may be the best choice.
In addition to the mind map icons, you will receive 24 additional vector icons. They are useful for illustrating the specific mindmap branch concepts, to represent different business categories and industries, for example.
Check the complete PowerPoint set here:
You can also check flat infographics collection to add more variety to your presentation graphics.


