Creative Inspirations for Presenting DevOps Toolchain Loop
When working in software development management, you may need to present the frameworks you use in a clear and engaging way. The best way is to show it all visually, such as a toolchain loop.
For example, when talking about Development Operations toolchain sequence, use a simple loop diagram. By using different styles and colors you can highlight and explain different stages and elements of the DevOps toolchain.
We’ve collected several examples for your inspiration, on how you can use such a loop diagram in a presentation.
Note: All example images below can be found in DevOps Toolchain Loop Diagram Template (see details by clicking the pictures).
Ways to present DevOps visually
1. Toolchain loop with summary descriptions
Flat graphics in a simple plain fill style always will look eye-catching and professional. They grab attention much better than text alone.
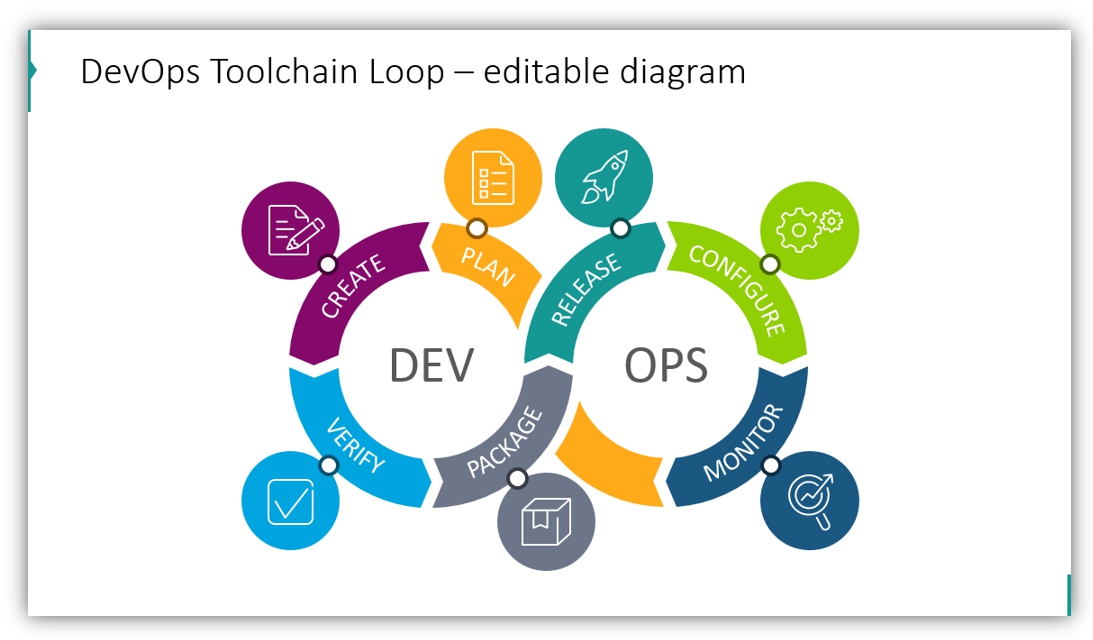
You may use outline style loops for elegant, light designs. With summary descriptions, you can supplement each step with additional information.
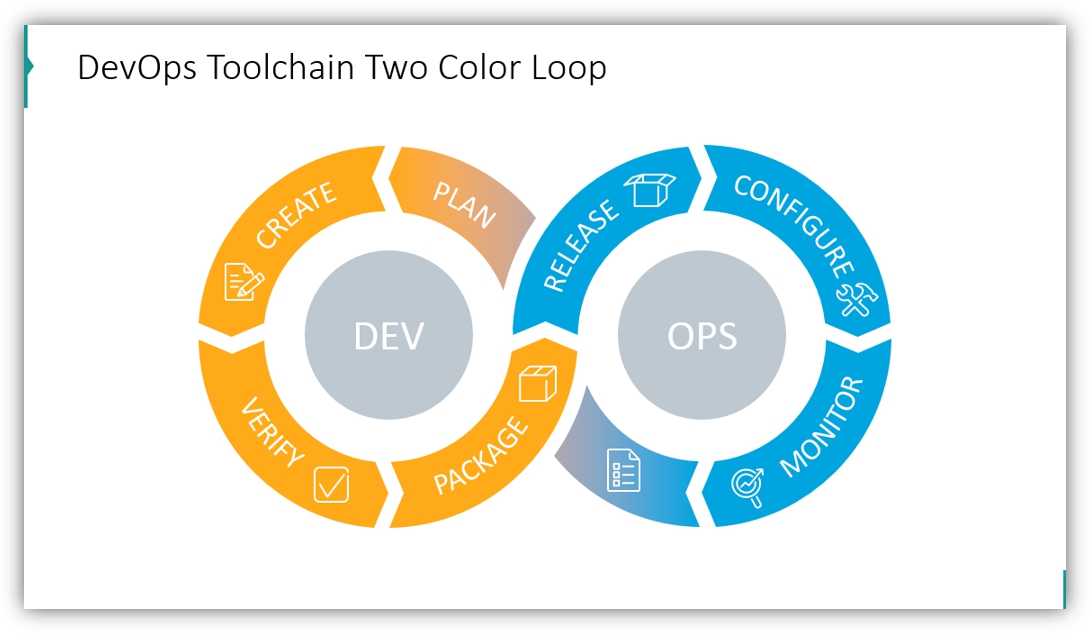
2. Present the DevOps toolchain loop by using two colors, one for each area
You may use two colors that are part of your branding, which are significant to the project/release you are discussing, or which are symbolic of the teams responsible for different parts of the process.
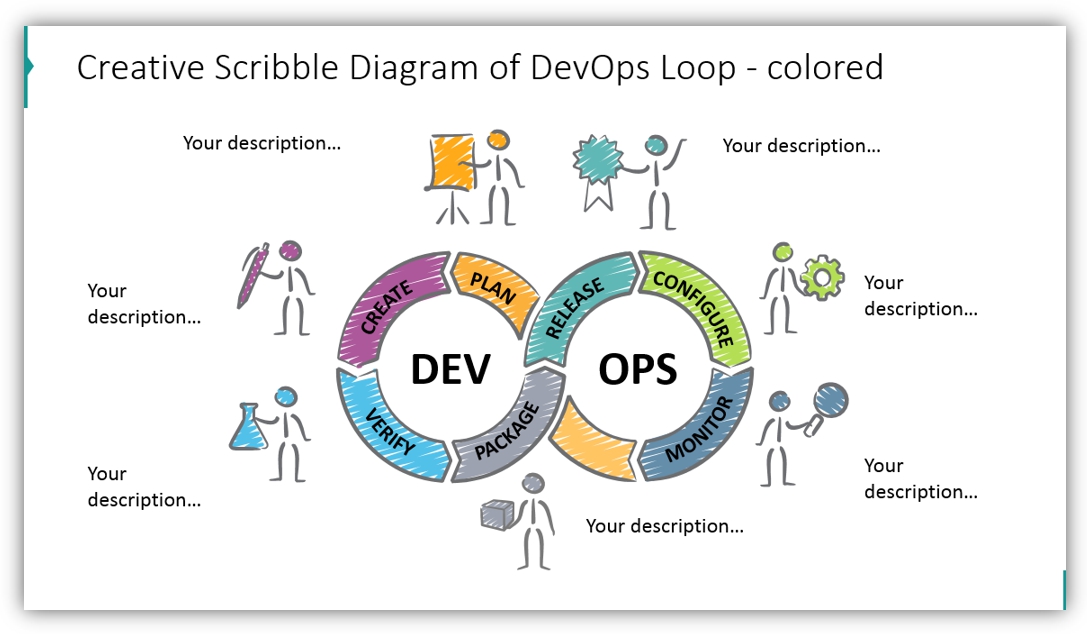
3. Creative Hand drawn DevOps cycle diagram
Use scribble graphics to add creative flair to your DevOps presentations. You may use some handwritten-like scribble elements to give it a personal organic look.
Having vector graphics, you can assign various colors to all DevOps stages, or make all grey and only one stage you talk about in some fresh color. Adding hand-drawn stick figures increases the visual power of the presentation slide.
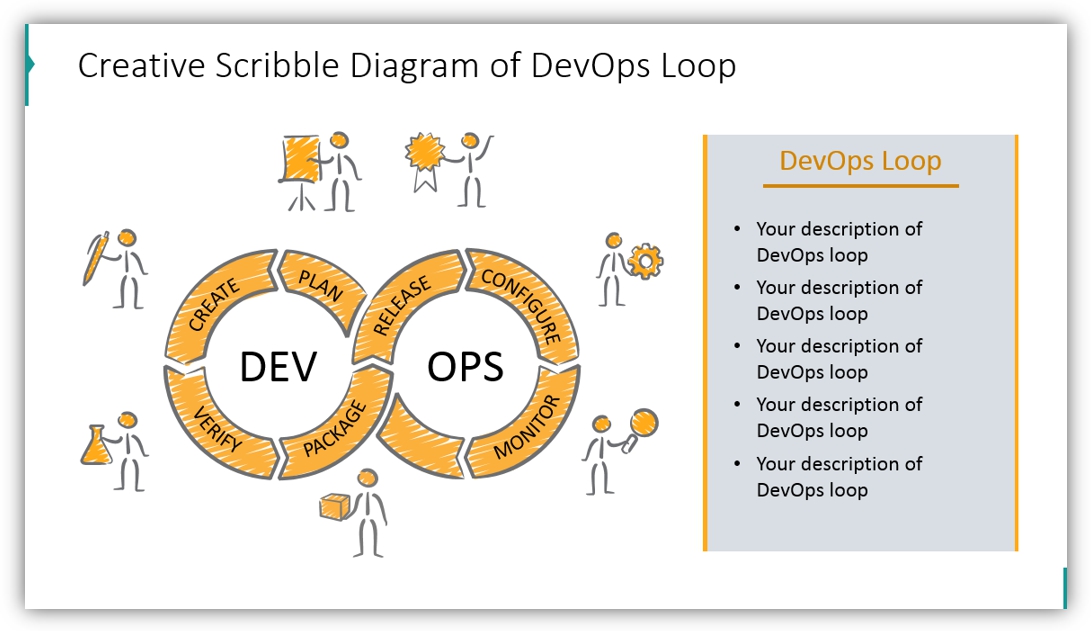
4. Scribbled loop with a simple color scheme
If you prefer a more moderate look, consider a simple color scheme. You don’t need to use different colors when presenting if you worry they would make your slide too busy.
See the example of the DevOps process picture on this slide:
operations and Quality Assurance
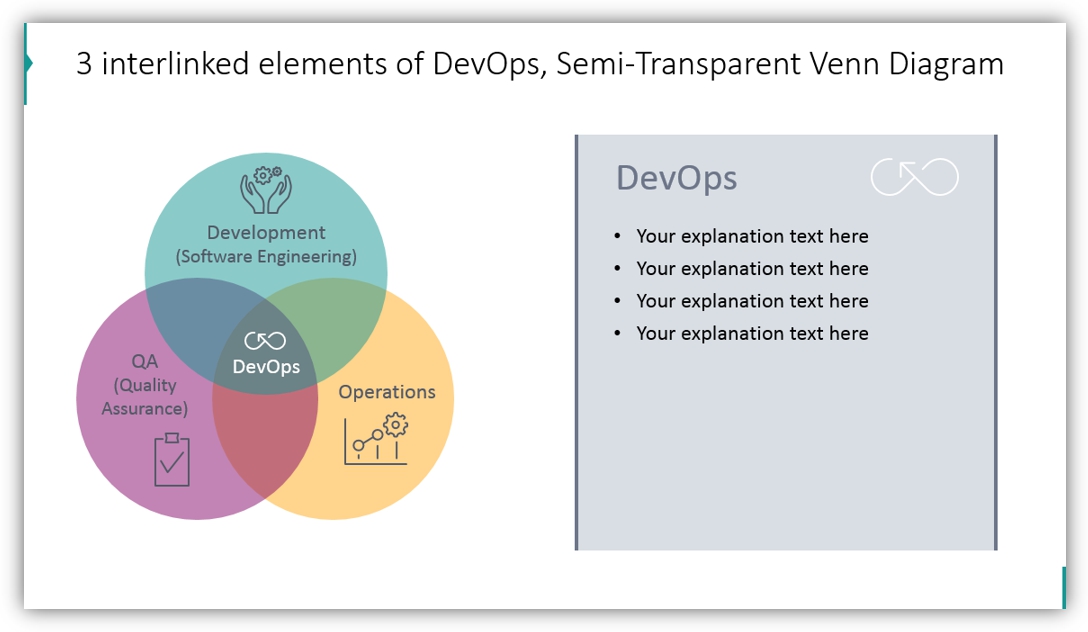
5. Presenting Interactions of DevOps and QA
If you need to illustrate the close relation between the three elements of DevOps, try the Venn diagram structure. Show an overlap of Sofware Engineering, Operations, and Quality Assurance as we did in the image below.
By adding a summary text box, you can explain how different stages of the process interact in detail.
Benefits of using diagrams for DevOps topics
Using strong and clear visuals helps to keep your audience focused on what you present.
Therefore it’s worth investing a bit of time to add some kind of simple infographics to your slides. It does not need to be a fancy one.
I hope those DevOps presentation examples inspired you. You can try to recreate them on your own, or make use of our slide deck template mentioned below.
Resource: DevOps Toolchain Presentation Graphics
To help you with your software development presentations we have created a DevOps loop PowerPoint template graphics set. These PowerPoint icons are available in 2 graphical styles so you may match the style to the purpose and audience of your presentations. You have a modern flat loop design and a creative scribble design. The set also includes 27 vector icons that represent the DevOps toolchain elements and other concepts.
You can also download DevOps Know-How Presentation Toolbox for more variety.


