Pros and Cons Slide: Creative Comparison Diagrams for PowerPoint
Compare options visually with pros and cons PowerPoint diagrams. See creative slide layouts for advantages vs disadvantages, comparisons, and decision-making presentations.
Do you need to add a slide with advantages and disadvantages in comparison to your presentation? In this blog, we offer visual examples of how to illustrate the pros and cons of a business process, product, strategy, or decision using visual aids.
Transform your business presentations with our expert resources. Discover more on our business performance presentations webpage.
Do you have any ideas on how to create visually appealing positive and negative slides? Don’t worry if your answer is ‘no’. Check the following creative slide design ideas we share in this blog. They will help you create are fresh, simple, and elegant presentation.
All example slides below are a part of the Pros & Cons Diagrams PowerPoint template (see details by clicking the pictures).
Why Use Pros and Cons Diagrams in Your Presentation?
Here are the major reasons for using graphics to highlight the pros & cons:
- Show the pluses and minuses of specific options
- Compare the gains and losses of a proposal in the decision-making process
- Visualize the benefits and drawbacks of the solution
- Highlight the major advantages and disadvantages of the product, process, strategy, idea, etc.
- Present a visual comparison of ups and downs on one slide
- Replace ordinary tables and lists with creative diagrams
Apply Pros and Cons Diagrams Instead of Ordinary Bullet Points
Are you going to use ordinary bullet points to list the advantages or disadvantages of the discussed subject? It would be better to visualize data to make sure that your audience will not miss any critical information.
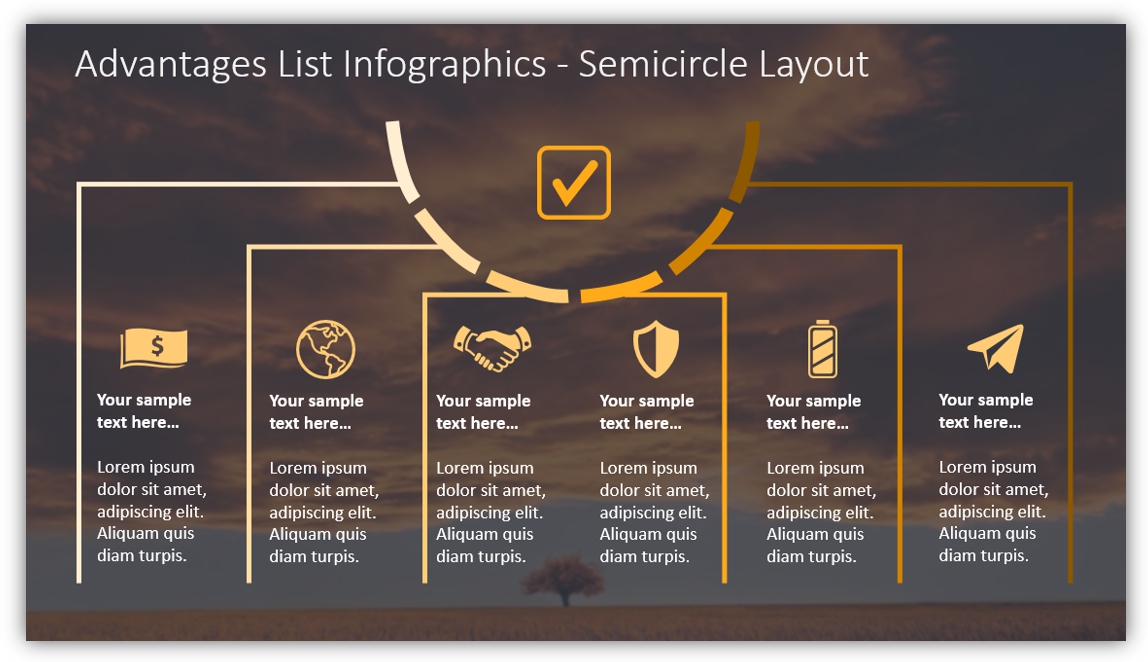
The example above demonstrates how you can transform a written list of the advantages into an eye-catching infographic. You can add different icons and short descriptions to draw your audience’s attention to small details, that matter.
Design tip: if you are going to add more icons in your presentation, remember to keep them graphically consistent. Use one style for all slides and limited set of colors – ideally based on your branding.
Looking for more list presentation ideas? See three creative ways of illustrating a list in your presentation.
Use Pros and Cons Diagrams Instead of Traditional Comparison Tables
Let’s face the truth, traditional Excel tables look pretty boring. If you want to make sure that your audience will not skip reading table information, you should pay attention to the slide design.
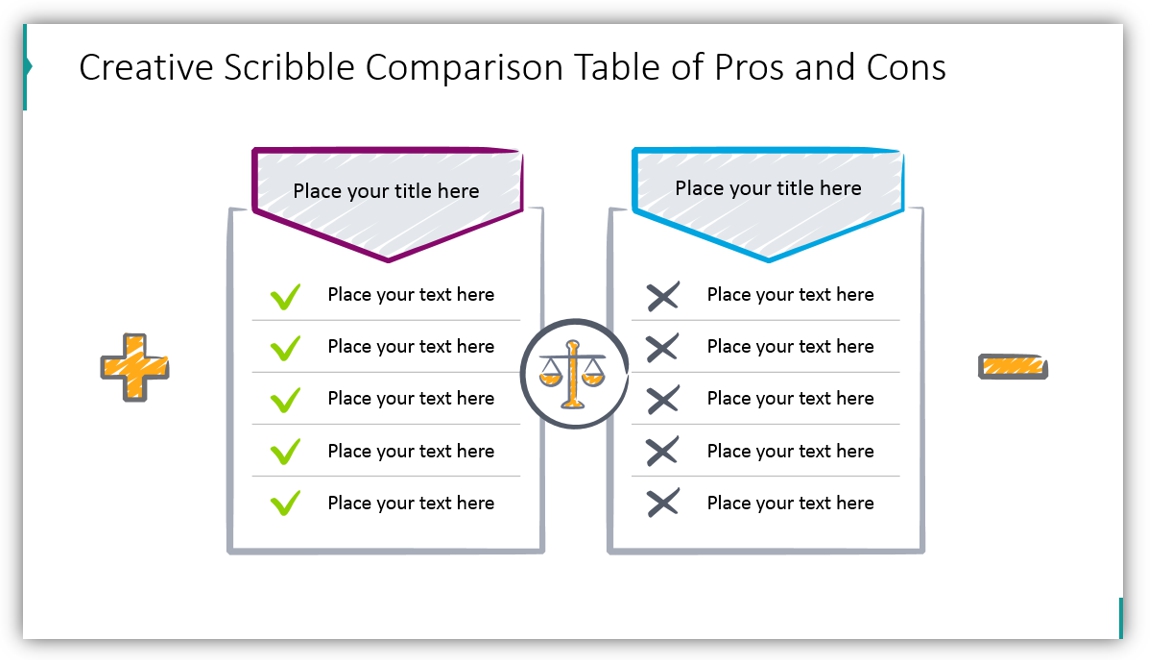
This slide example shows how you can highlight pluses and minuses utilizing a non-standard table. We also added hand-drawn icons and elements to make the table look creative and unique. Such hand-drawn visuals can help make your presentation more impactful.
Highlight the Pros and Cons On Two Separate Slides
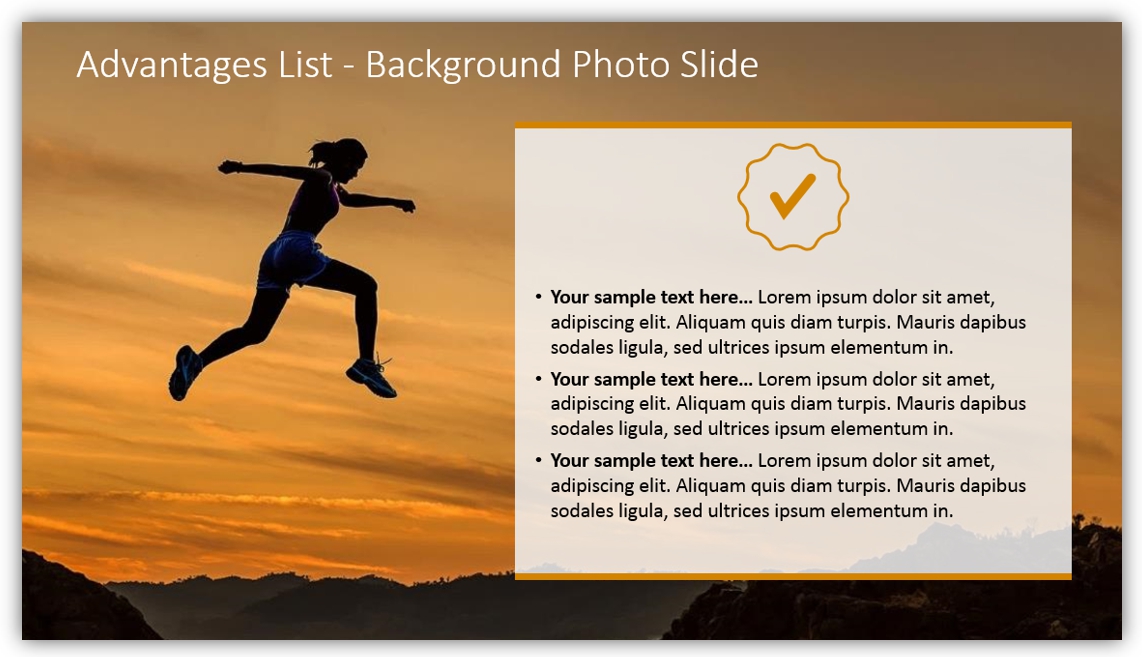
In case you want to discuss the advantages of the topic in more detail but don’t want to overload the slide with text, you can choose the following design. A relevant background photo and a small text section work great together. Visualization of this type makes your message clear and concise helping to retain the audience’s attention.
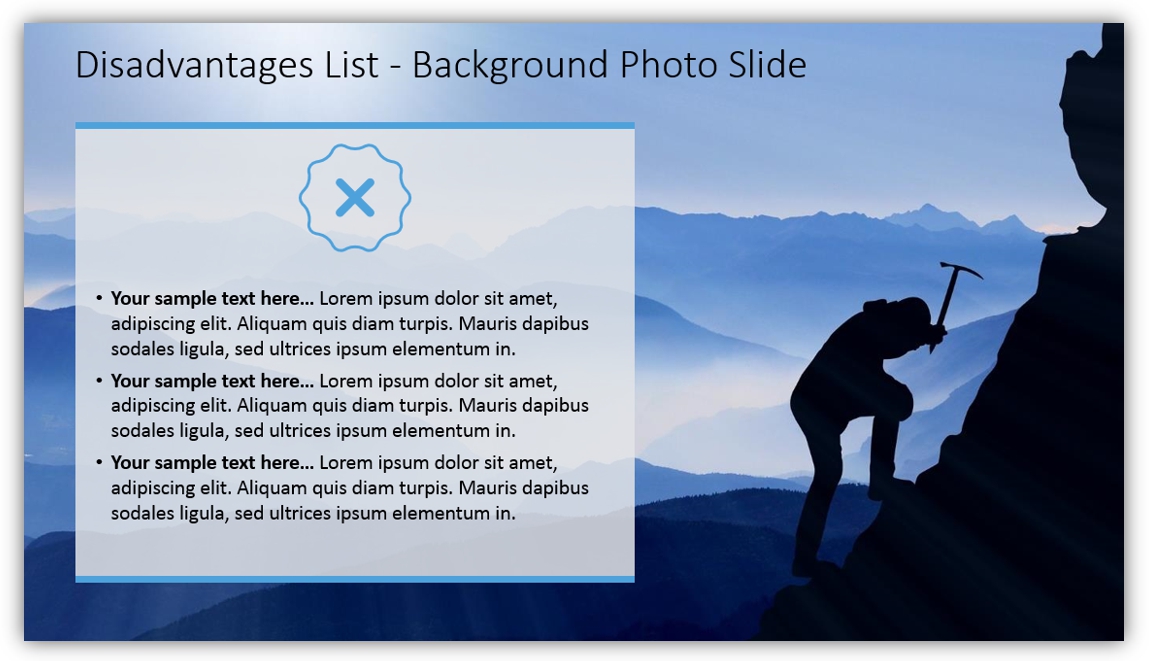
You can also apply this design to list the disadvantages. Take a look at the following template: a high-resolution image pairs well with a short bulleted list and a few simple icons. These two slides will look great next to each other.
Put Benefits and Drawbacks On a Final Slide
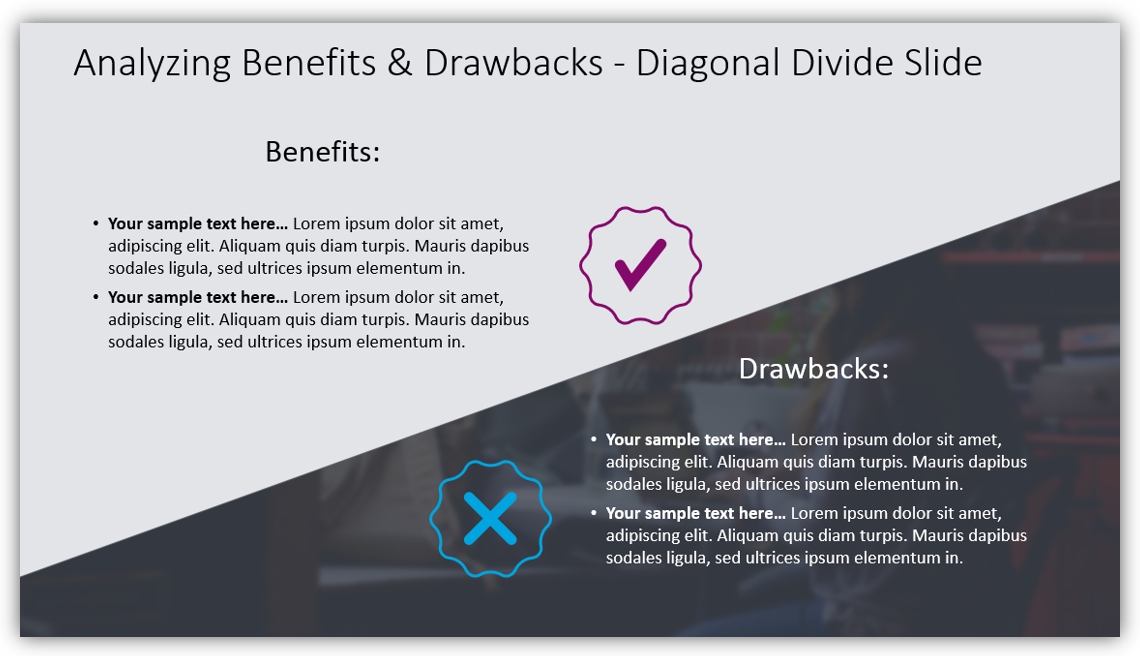
If a major goal of your presentation is to focus on the advantages and disadvantages of the discussed idea, we suggest adding a pros and cons diagram for a final slide.
Take a glance at the following template, which presents benefits and drawbacks in a simple, yet effective way. The slide divided diagonally looks more creative and will suit any presentation. You can add big icons (like on the picture) to show where you stated the benefits and drawbacks.
As you can see, there are a lot of unordinary Pros and Cons slide designs to choose from. You just need to select the most suitable diagram to create a killer presentation.
Don’t be afraid to experiment: you can use several slides in the same presentation. For instance, you can focus separately on benefits and drawbacks, and then sum it up with a final slide with the most essential points. Just remember about visual consistency.
Do you need to create a to-do checklist slide for the project or review a presentation? You can rearrange and reuse one of the above diagrams, e.g. a slide with a tick and cross. Here we share more ideas on creating To-Do checklists for various purposes.
Resources of Comparison Diagrams
To save you time developing such comparison graphics, we designed an editable PowerPoint template with various pros and cons slides. Go and create engaging infographics, you can check the whole collection here:
You can also check the flat infographics deck to make your slide readable and distinguishable.
Need to illustrate other business topics? You can also explore our tutorial video for step-by-step guidance on creating engaging All Hands Meeting presentations:
Author: Leona Henryson – freelance writer and UX designer. Also, she is a contributing writer for various blogs. When she is not writing or designing, she is swimming, hiking, and, weather permitting, snowboarding.


