Help Your Audience Connect the Dots by Presenting Visual Metaphor Bridge Diagrams
What do you think when you hear the phrase ‘bridge the gap’? This concept has many different applications. Whether you’re bridging the gap between different industries, departments, or teams, or simply connecting two concepts, bridge diagrams can help your audience understand.
Regardless of your intended message, you can demonstrate the transition from your current state and the desired outcome. That isn’t all. With similar icons you can express gap analyses, animate timelines with milestone pillars, and even show how to bridge the gap between what your customer needs are and what your company or department offers.
All example slides below are accessible in Bridge & Gap Graphics PPT Template (see details by clicking the pictures).
Explain the Bridge the Gap Metaphor Effectively with Visuals
Explain Gap Analysis and Show the Transition from the Current to Desired State
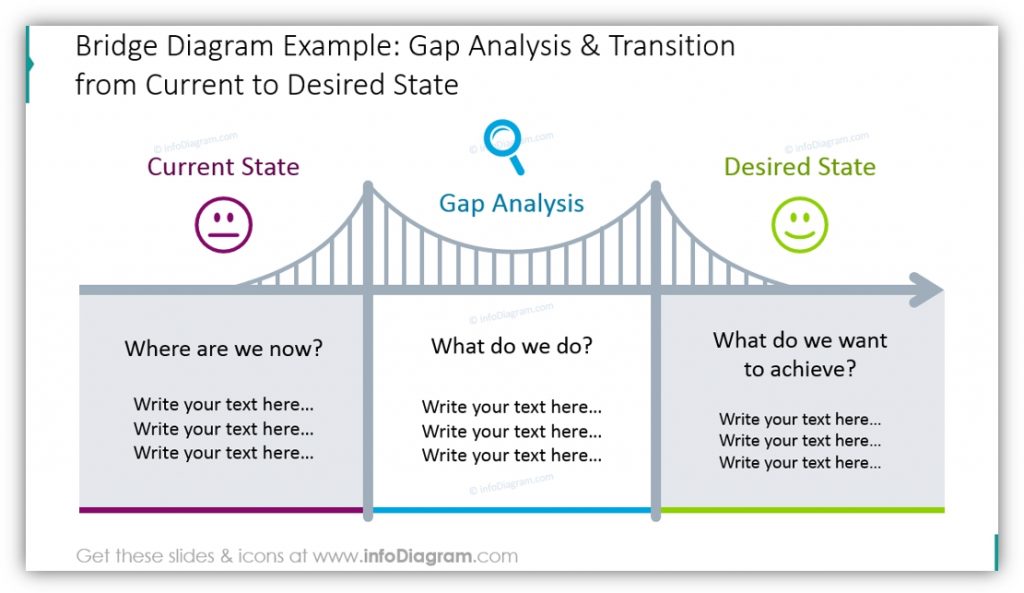
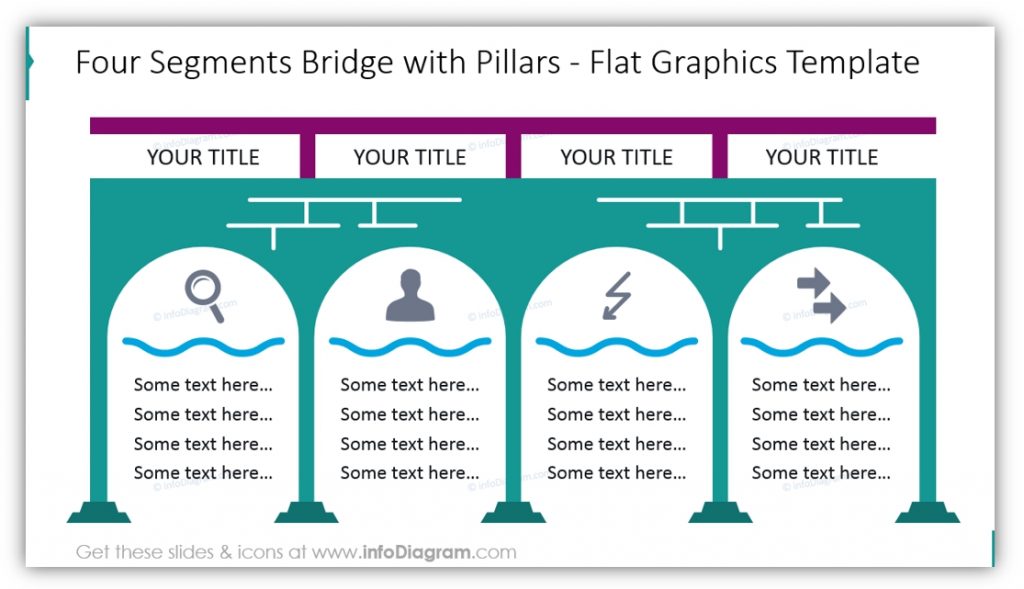
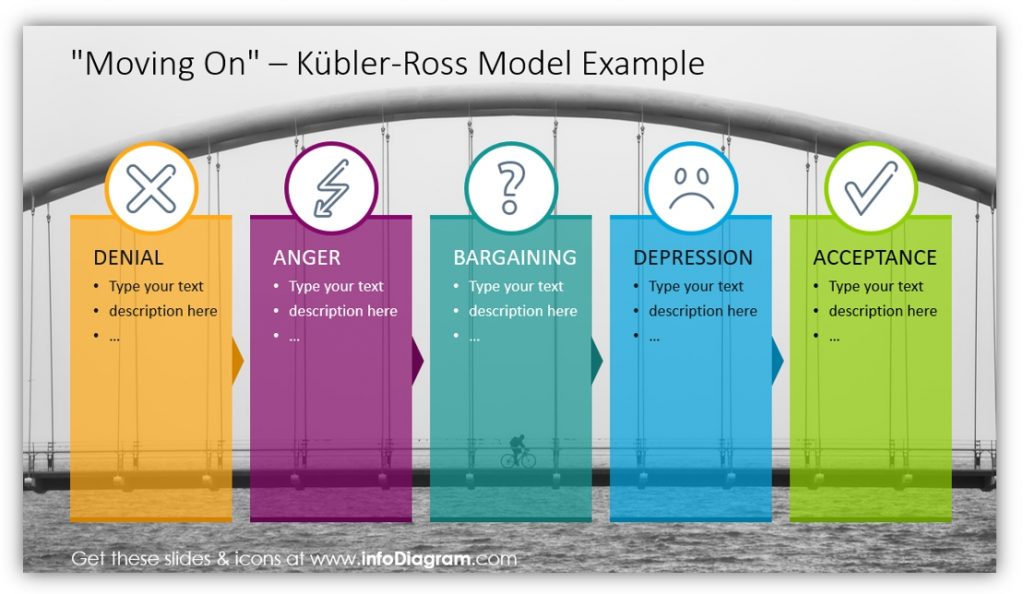
By using bridge diagrams you can paint a clear picture for your audience. In the first example, the current state is represented by an unhappy face. There is space in the diagram to answer the question “where are we now?” so you can provide additional details about the current situation. The gap analysis stage aims to answer the question “what do we do?” which allows you to outline what separates the current state from the desired state. The desired state is the final phase of the diagram. It aims to answer “what do we want to achieve?” which is essential. Once your audience understands the end game they can make progress toward it. If, as in the second example, you have more than three stages you need to represent you can easily customize the bridge to match your situation.
Illustrate a Bridge Transition Model
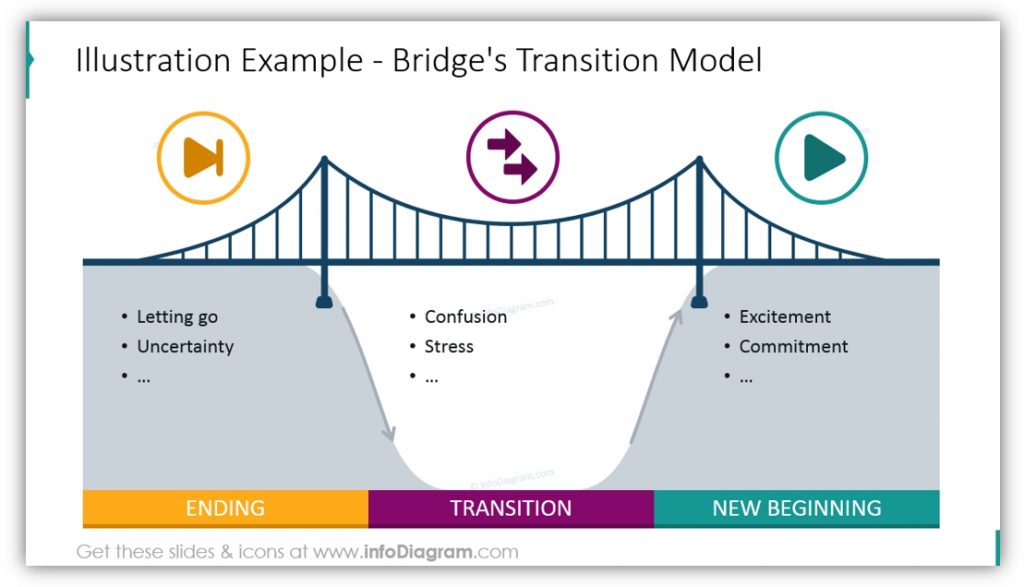
Rather than simply describing where you are, what separates you from your goal, and where you’d like to be, you can use a bridge transition model. Show the ending, where you are or were before transitioning; the transition, the steps between; and the new beginning phase. You don’t need to use full sentences, simple use of adjectives or simple phrases is sufficient to drive the meaning home. You can choose the icons you’d like to represent each phase, and customize the colors to match your brand or another color scheme.
Use a Different Vantage Point to Make Your Message Clear
Are you worried your audience will lose focus or might benefit from another point of view? This icon set provides a different perspective. You’re still showing the difference between two things, in this
Explain a Timeline or Different Stages of a Process with Milestone Pillars
In this
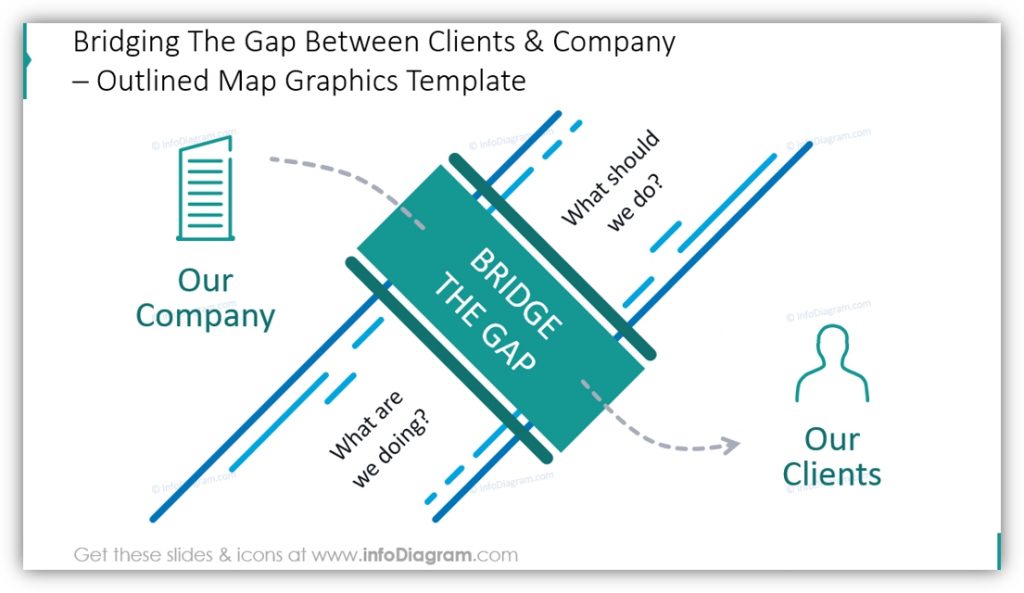
Simplify Your Transition Bridge
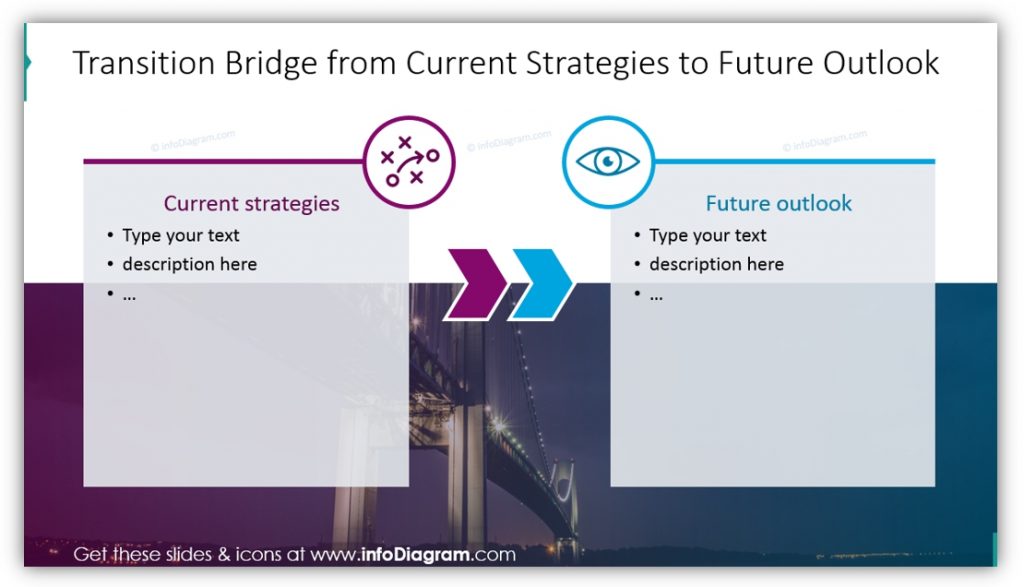
The focus of your transition bridge can be on the current strategies or placement and the future outlook and ultimate goal. Focus on what you’re doing, and provide details. Then do the same thing for highlighting your future outlook and goals. The icons can be modified if you would prefer to represent your company in one block and your clients in the other or make even more dramatic changes to suit your purposes.
You can explain gap analysis and show transitions, illustrate bridge transitions, use different vantage points to help your audience understand your message, or explain timelines, the different stages of a process, and simplified transition bridges. You can do even more with bridges since getting from one point to another is such an essential part of presentations.
Resource: Bridge and Bridge Gap Graphics Template
You can use the bridge and bridge-gap graphics to make your presentations more eye-catching. Your audience will remember more of what you present if you use engaging graphics. In addition to customizing the color palette, icons used, text featured, shadows, and the size and outline of the icons used you can also add animations or additional symbols. Anything you can do to tailor your presentation to your topic will help your audience focus and retain your content.
If you find the above examples useful or helpful you can down the full slides set here:
You can also download the infographics collection for more presentation graphic variety.


