Use Modern Graphics to Teach Six Sigma and DMAIC
The Six Sigma framework was developed in the 80s by Motorola. The goal was to create a system for quality improvement. Conveying things like the main principle of Six Sigma is to work on decreasing defects in the production process. The goal is to get defects to a level that is not statistically significant. Six Sigma represents a very low probability of event occurrence.
Explore our Business Performance PPT Reports category on the website for more resources to boost your presentation impact.
Explaining how to create this system can be challenging. DMAIC represents the improvement process cycle. Of course, just explaining the concepts and breaking down the meaning of the acronym is often not enough. By using creative graphics you can provide detailed explanations which aren’t overwhelming for your audience.
Note: All example slides below are accessible in Six Sigma Presentation DMAIC PPT Diagrams (see details by clicking the pictures).
Offer Detailed Descriptions of Unfamiliar or Technical Terms
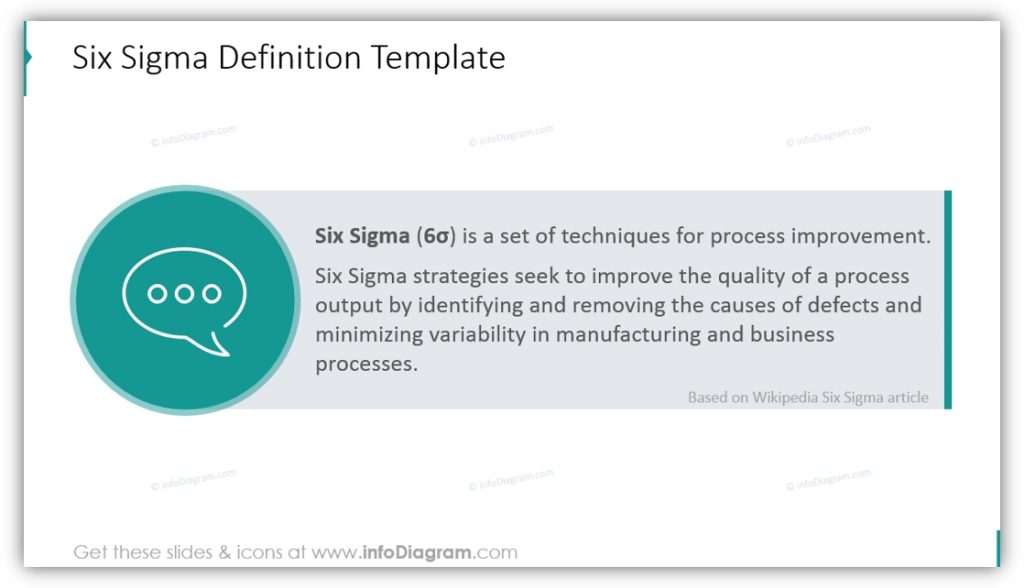
If you’re explaining Six Sigma or DMAIC to individuals who have little or no background in either one, you should expect to define many terms. By spelling out exactly what it is that you’re discussing you can make sure everyone is on the same page. Also, by providing a visual definition rather than simply reading it aloud, you can better hold your audience’s attention.
Answer Questions with Graphics
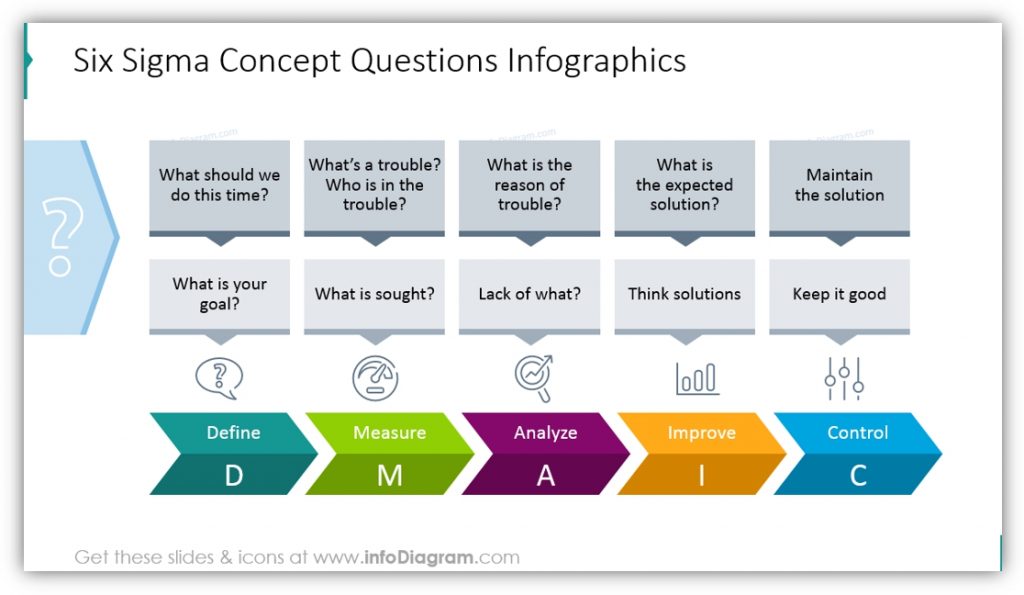
There are multiple ways to put this slide to use. One is to explain the questions which make up DMAIC. These are the common questions that occur in most situations requiring six sigma. Another option is to offer explanations for questions you expect your audience would have. These can be questions about how Six Sigma is beneficial, why it’s worth the effort, or how it can be best utilized.
Explain the Mathematical Elements of Six Sigma
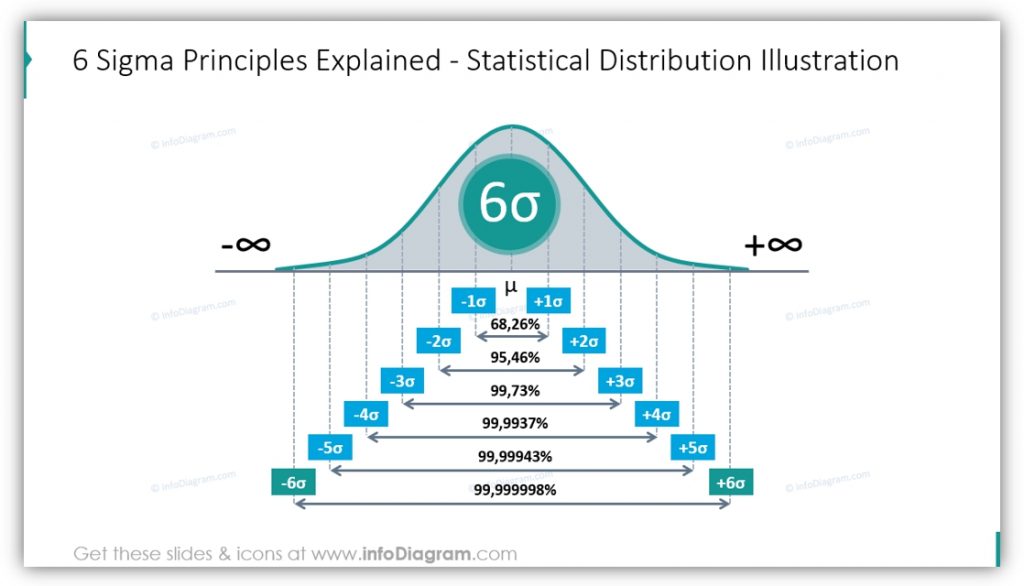
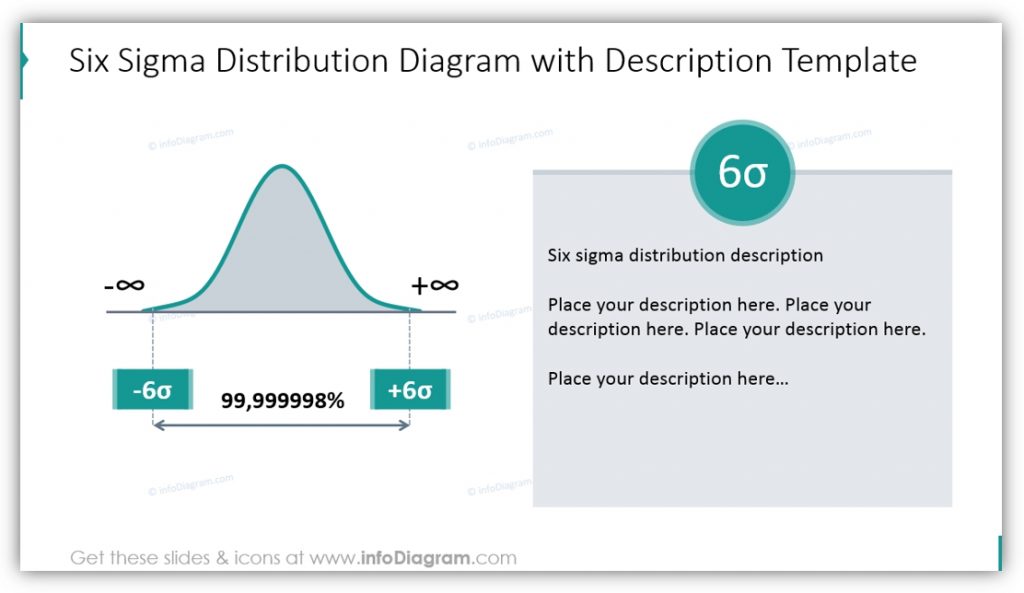
If there is one aspect of the Six Sigma framework that is likely to be misunderstood, it’s breaking down the mathematical side. Helping others to understand the statistical distribution and how statistical significance or statistical insignificance factors into Six Sigma is arguably the most important, and challenging part of presenting these topics.
Showcase the DMAIC Problem Solving Workflow
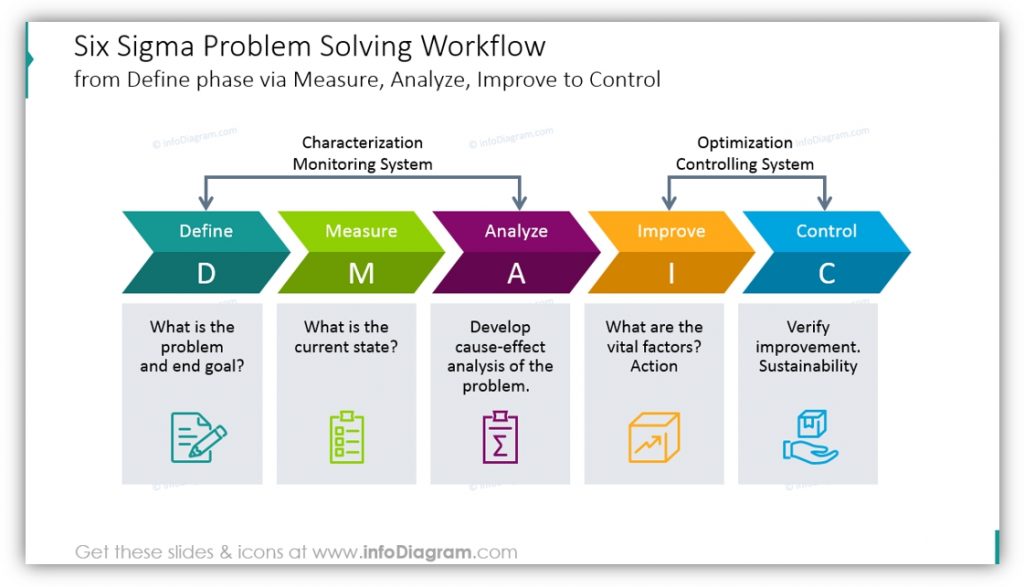
Highlight and explain the different steps of the DMAIC workflow. You can change the colors of each step to match your branding, project, or other significant aspects of your presentation. You can add icons, as illustrated here, to make each step more relatable for your audience. You can use this for specific examples or general concepts.
Explain the Lean Six Sigma Methodology Flow Chart
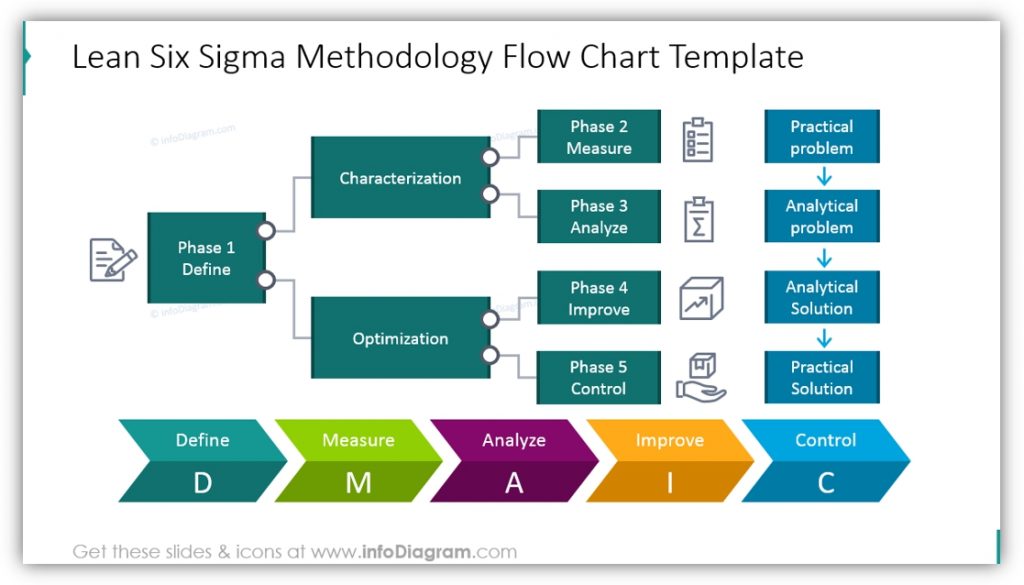
If you want your audience to understand how this model works on a practical, functional level you should consider utilizing a flow chart. Although the above example is relatively sparse, you could easily dedicate one slide to showing the process and another to explain how the process would function in your department or for your audience. Use real examples from their real-life workflow to populate your slide. This will make your presentation relatable and easier to understand.
By defining difficult concepts, answering questions with helpful visuals, detailing mathematical elements, and showing real-life uses of the process you can successfully explain and make a compelling argument for Six Sigma and DMAIC.
For more inspiration, subscribe to our YouTube channel:
Resource: Six Sigma Presentation DMAIC Diagrams
Using the modern graphics set you can effectively define and explain the principles of Six Sigma. You may also demonstrate how Six Sigma and DMAIC can help your audience in day-to-day life. This will make a compelling argument for the framework and help solidify its utility. You can explain the basics or a detailed plan of action.
If you find the above examples useful or helpful you can down the
You can also download the infographics collection for more presentation graphic variety.


