Global Trade Finance Explained with Presentation Diagrams
Do you need to explain trade finance or global trading concepts? Use visual diagrams to illustrate how mechanisms work. Engage your audience by using relatable imagery.
By using specific symbols you can help your audience follow processes and understand the topic of discussion.
Note: All example slides below are accessible in Trade Finance PowerPoint Diagrams (see details by clicking the pictures).
Let’s see how graphics can improve your trade finance presentations.
Provide You With a Visually Interesting Definition Slide
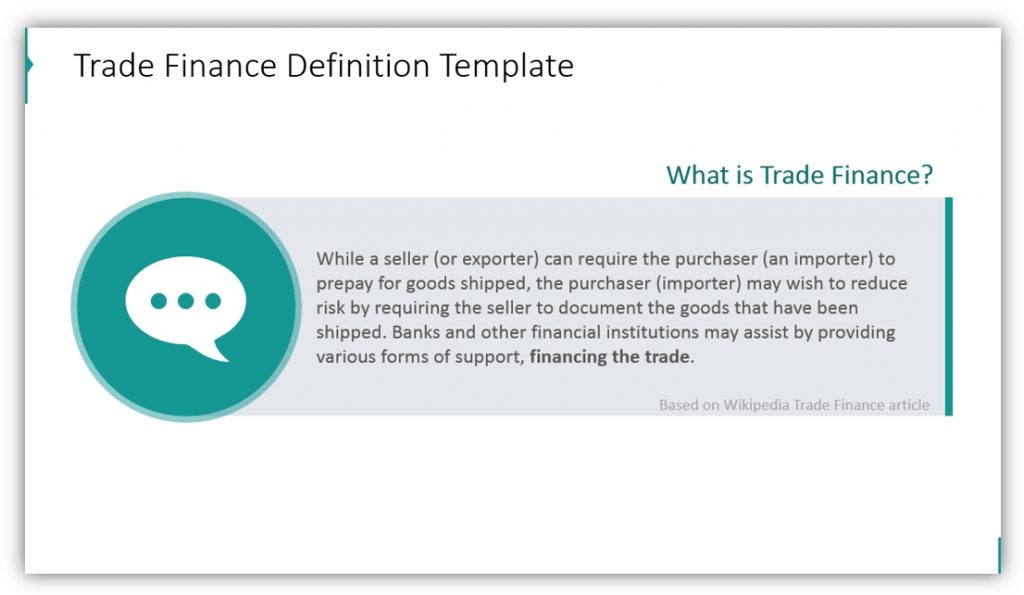
Creating interesting slides to define unfamiliar terms is easy with graphics. Make a stunning slide to highlight any complex or unfamiliar terms. Design presentations with your audience and their needs in mind. Even if the terms you’re using are obvious to you, remember who you’re speaking to. If they need additional help, give it to them. It will help them follow the more difficult material.
Explain Simple Concepts You Can Build On
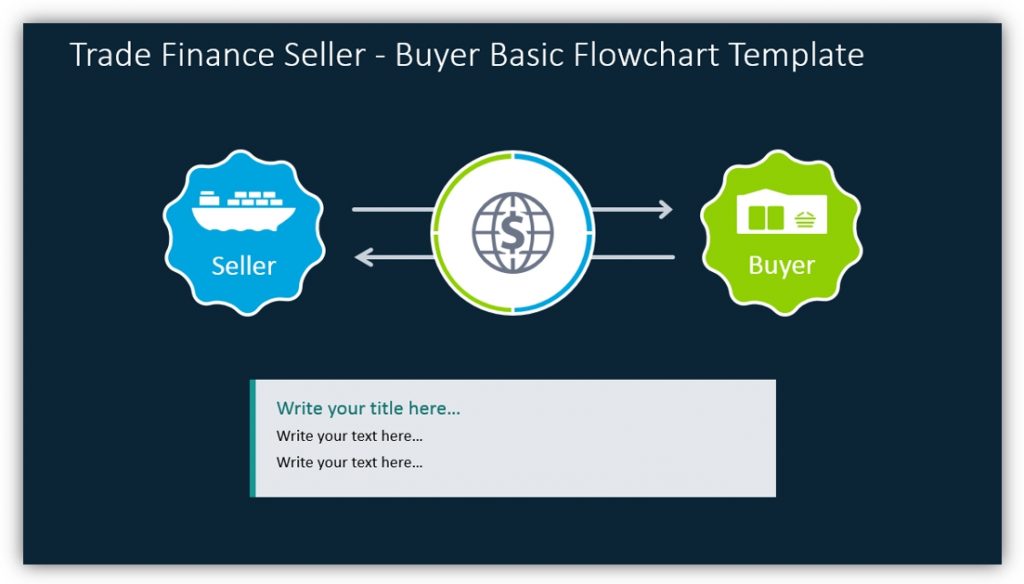
Basic Buyer Flowchart Templates can be expanded on for more complex situations. By providing an explanation for simple transactions or terms, you can provide a contextual basis to build on. Text boxes allow you to provide additional details and supplemental information. You can even add additional text boxes to represent the other players in trade finance such as importers and exporters, suppliers, and others who make it all possible.
Illustrate Bridging the Exporter and Purchaser Gap
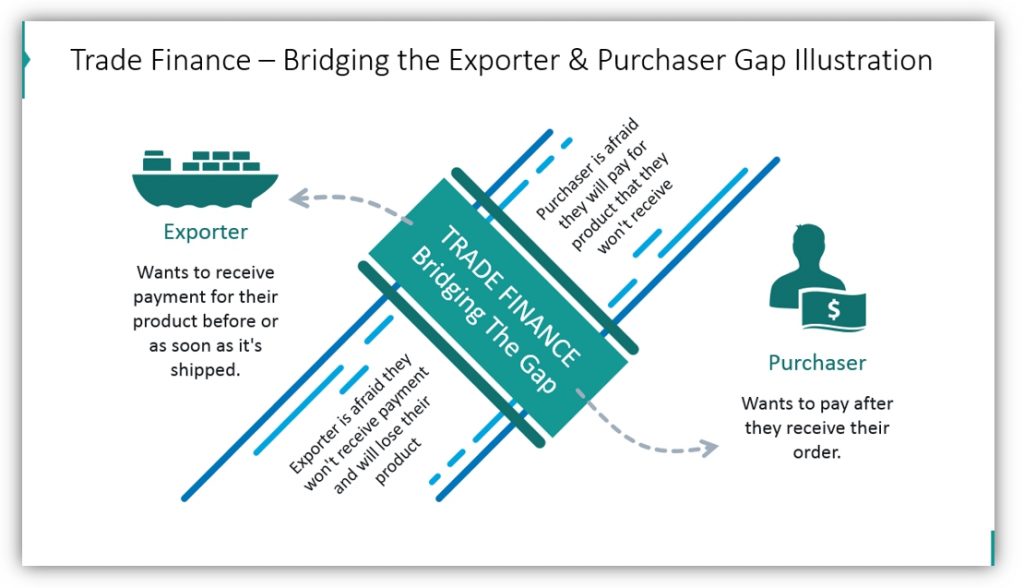
Explain how trade finance helps exporters and purchasers to bridge the gap between them. By using a bridge metaphor you can highlight the desires of the exporters and purchasers, their concerns, and how trade finance makes it possible for the two to do business despite their concerns.
Explain the Roles of Providers and Users in Trade Finance
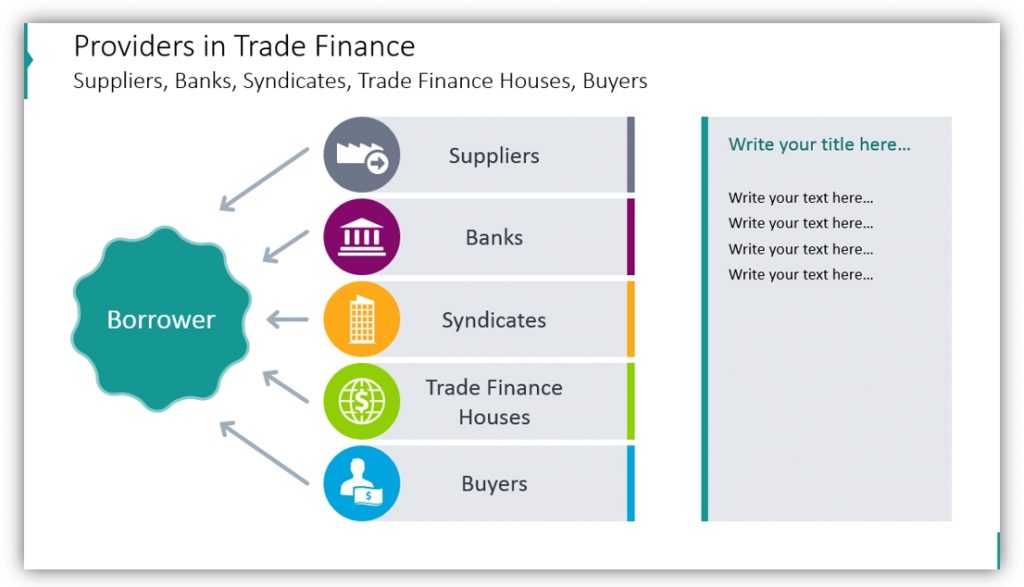
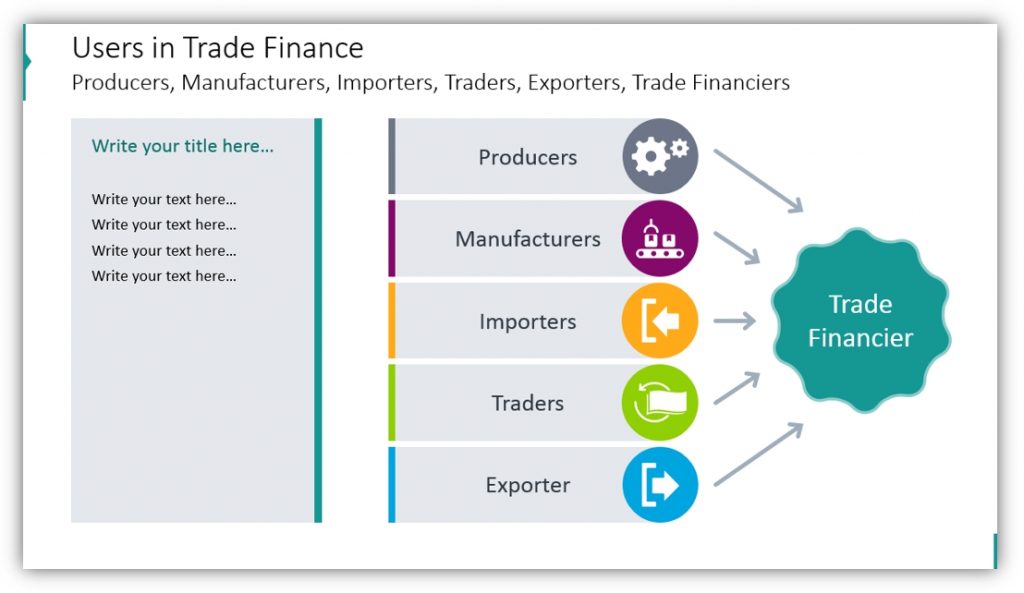
Explain how suppliers, banks, syndicates, trade finance houses play into trade finance. Explain how producers, manufacturers, importers, traders, and exporters function in trade finance. Share their similarities and differences, and provide as much supplemental detail as you need in additional text boxes.
Explain the Documentary Collection Process with Diagrams
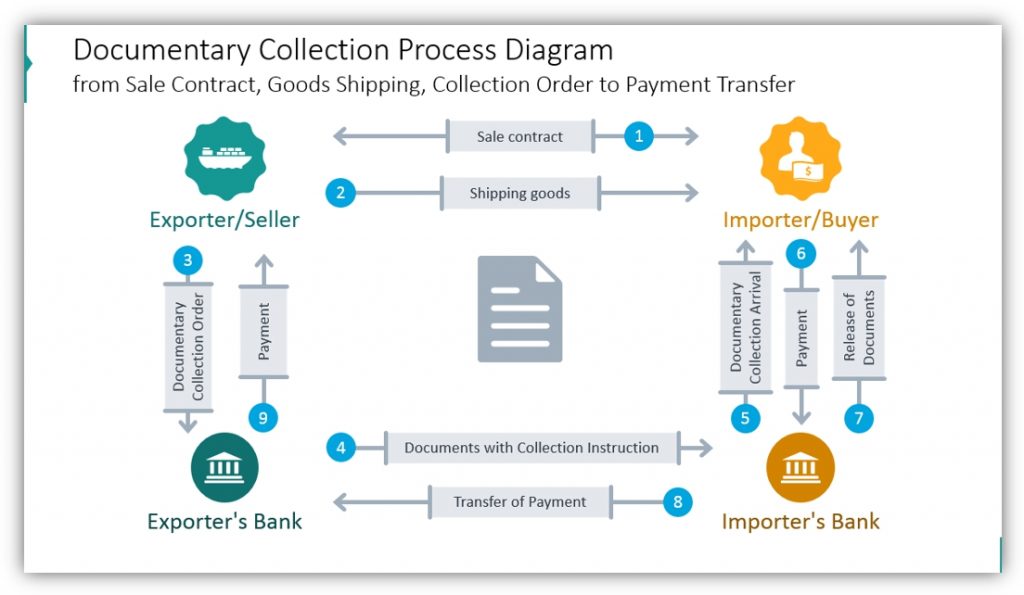
Flowcharts can help your audience make sense of numerous trade finance processes. You may also share the structured commodity trade
You may create compelling definition slides for unfamiliar terms and create slides for simple concepts and processes you can build on. Use creative imagery to explain unique problems, situations, and processes which are integral to understanding trade finance. Customize all of these diagrams by changing the color, icons, and outline thickness to create a truly one-of-a-kind, professional presentation.
Resource: Trade Finance Presentation Diagrams
For those who do not work in trade finance or who are unfamiliar with the trade finance procedures, images can help clarify the often complex processes. You can showcase the pros and cons of letters of credit document collection and other processes. This will help your audience better understand the detailed ins and outs.
Flow charts and maps with global trade routes and finance flow help audiences to understand so much better than simple slides with lists and dense text. Make your presentations fun for your audience and easy to follow.
If you find the above examples useful or helpful you can down the trade finance diagram set here:
You can also download the infographics collection for more presentation graphic variety.


