Make Stylized Closed Cycle Process Diagrams in PowerPoint
When should you use a closed-cycle diagram? When you need to show a repeating process. Why should you create stylized closed cycle diagrams rather than use default, simple, SmartArt diagrams? All imagery is not created equally. If you want to have an interesting, visually striking presentation then you’ll have to create or modify your own diagrams.
Visually attractive presentations are more memorable, especially if the imagery used helps you to convey information.
Want to use a colorful, creative style but don’t have graphic design skills or the time to build your own? Check out Cycle Diagrams & Wheel Charts for PowerPoint. Grab your audience’s attention with unique-looking graphics.
Why should I create a closed-cycle process diagram?
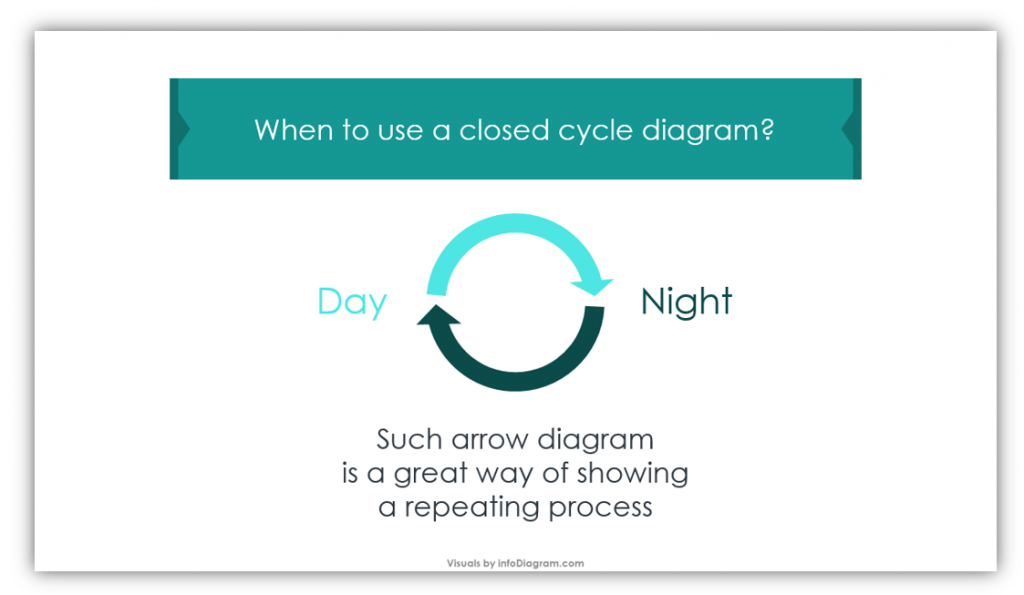
Do you need to show a repeating process? Would your audience benefit from having a visual explanation of a repeating cycle? These are the circumstances in which closed cycle diagrams shine. If you need to present economic activity, OODA loops, dispensing errors casual loops, and any other repeating cycles you can think of.
Timelines are fantastic for displaying the passage of time, however, they don’t allow you to really explain repeating processes. Timelines are linear, whereas cycle diagrams, as in the above slide, provide a clearer picture of processes.
In this blog, we’ll share how you can easily create closed-cycle diagrams. Let’s get started!
Create a “text cycle” SmartArt
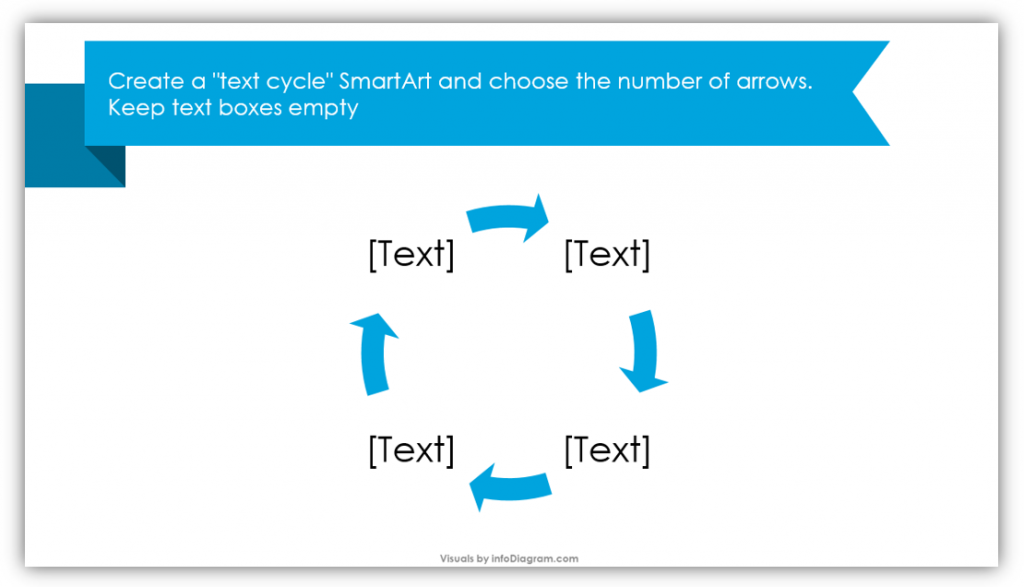
Choose the appropriate number of arrows when you create the object, and create a “text cycle” SmartArt. Be sure to keep the text boxes empty, as they will need to be modified before you begin filling in the details of your cycle or process.
Change the color of the text boxes
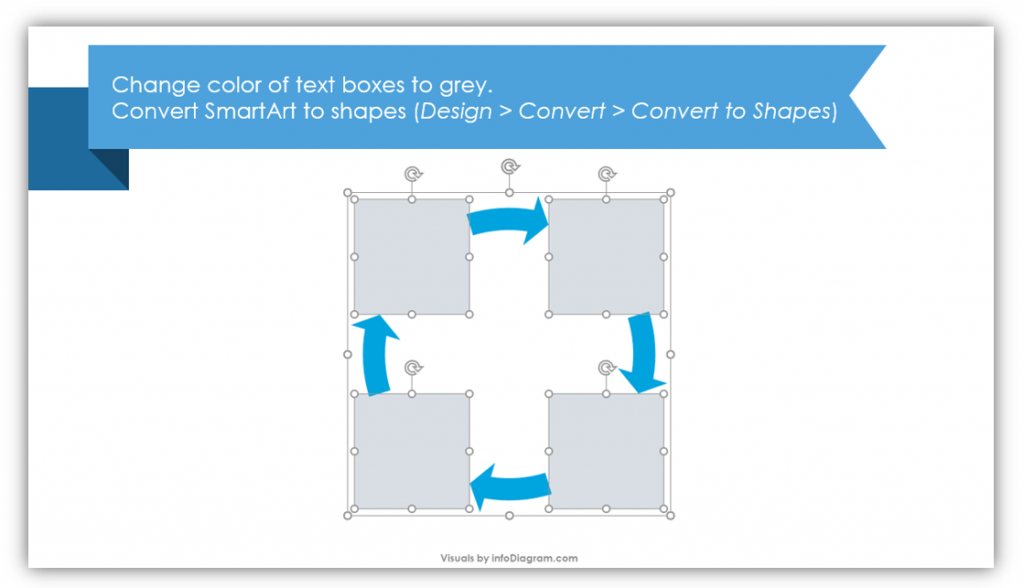
In this example, we’re changing the color of the text boxes to gray. You’ll also want to convert the SmartArt to shapes. The method for doing this is to select “Design” then “Convert” then “Convert to Shapes.”
Select all of the text boxes and turn them into ovals
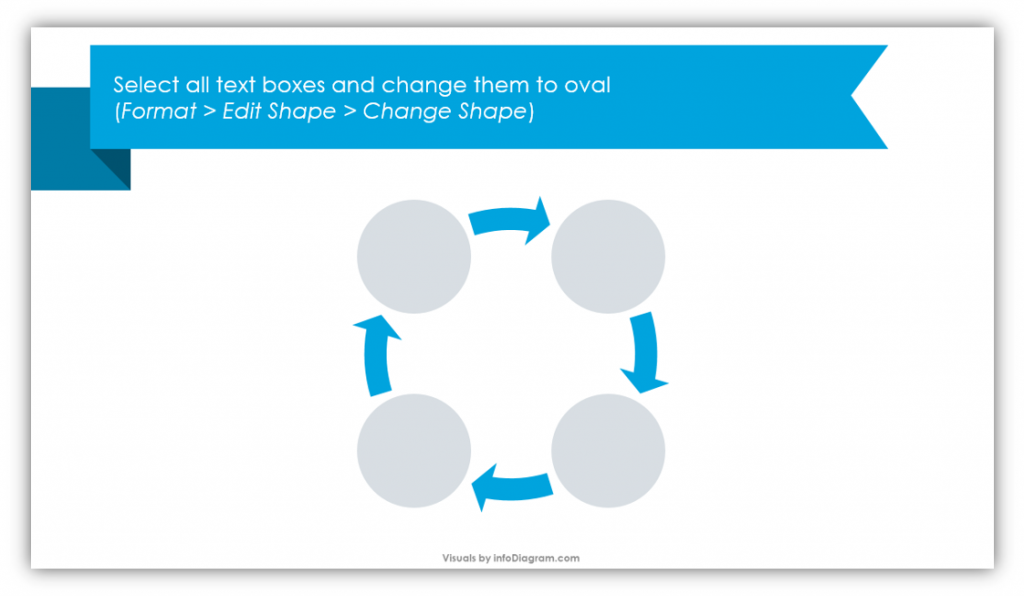
Select each of the text boxes from your SmartArt. Change them to ovals. You’ll achieve this by selecting “Format” then “Edit Shape” then “Change Shape” and selecting oval.
Change the colors of the arrows to suit your needs
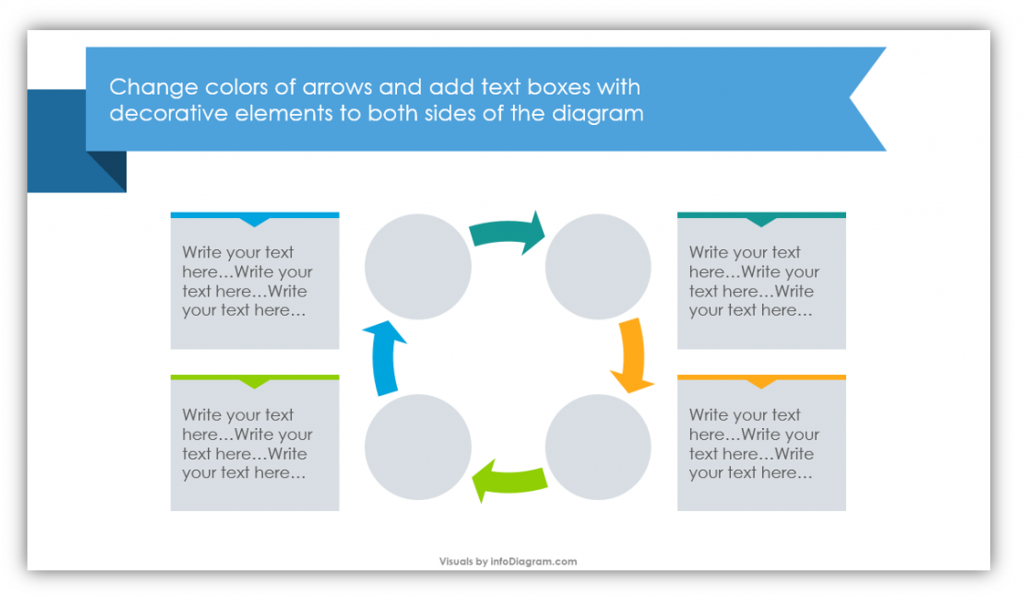
The next decorative step should be changing the colors of the arrows to suit your needs. You can easily change the colors of all arrows so they match, or modify them in the way that is pictured here where each color represents a different step. At this stage, you can also add additional text boxes and decorative elements.
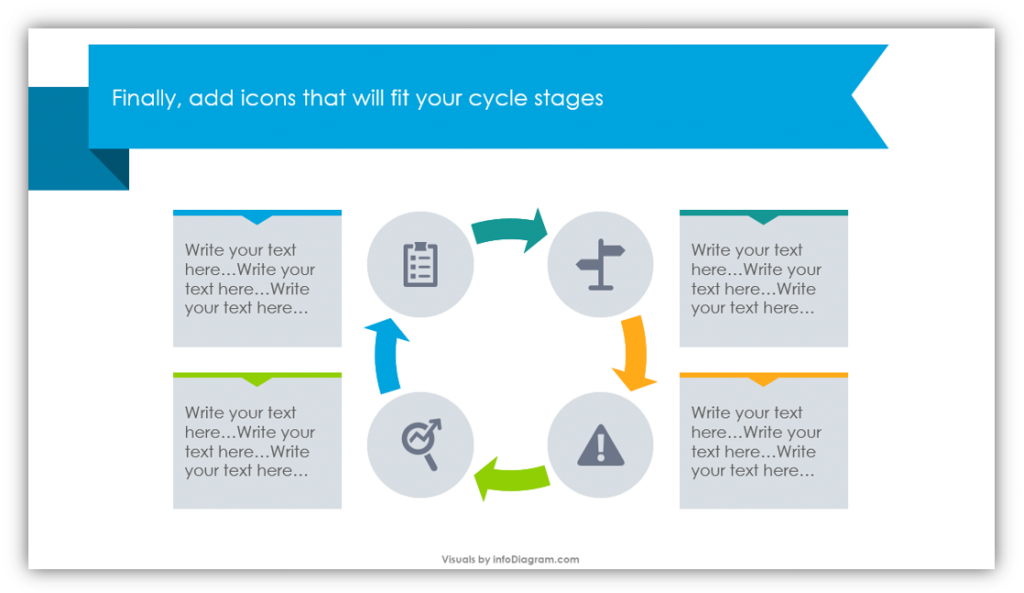
See how adding text boxes gives you more room to describe each step and stage of the process you’re describing. The more context you can provide, the easier it will be for your audience to follow along and understand your message. Add icons into the ovals which represent the cycle stages.
Get inspired and customize your closed cycle process diagram with relevant colors and icons. Your presentation will be as stylish as you make it!
If you don’t want to go to the trouble of creating your own closed cycle process diagram or have several to create for a particular project or presentation, check out our 38 Modern Cycle Diagrams and Wheel Charts. You’re welcome to re-use the templates provided in the set or make your own using our tips or the icons in the set. You can always also add additional slides from flat infographics bundle.
Graphical Resources: Cycle Diagrams & Wheel Charts
To help you make closed cycle process diagrams we created Cycle Diagrams and Wheel Charts in modern and scribble styles. You can see the full diagram set by clicking here:
There are specific OODA Diagrams in the set, as well as linked loops such as CausalLoop Diagrams of Dispensing Errors. The sets allow for as many as 7 elements in a single process, so even your most complex needs can be easily prevented with minimal labor and customization efforts. Think about your most complex process. Wouldn’t it be easier to explain with closed-cycle diagrams? Why only use them for the most difficult explanations?