How to Use 3D Brick Graphics in PowerPoint
Would you like to have more fun with your presentations? Incorporate plastic building brick graphics. Plastic toy blocks are popular with children and adults who want to add a playful element to their presentations. Would you like to utilize fun and creativity?
If you know how you can use building block icons to enhance your presentations, check out the full 3D Bricks Blocks Diagrams set here!
If you have ideas for incorporating these playful, colorful bricks that we don’t list, we’d love to see your ideas in action.
Use Blocks in Place of Bullet Points for a List
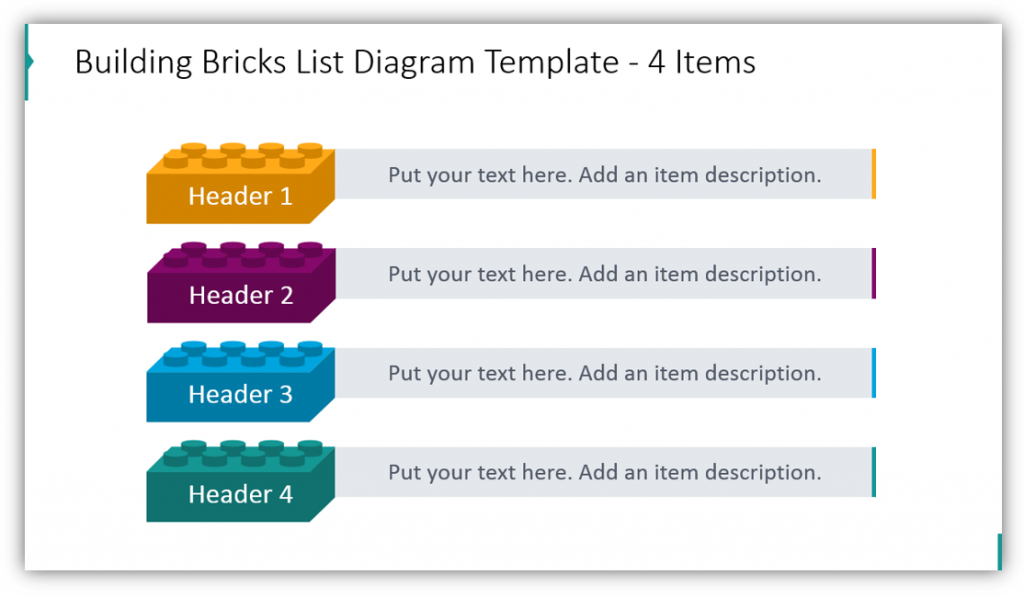
Whether you are listing business concepts, a sequence of events, or something else plastic, blocks are a clever, creative way to make the presentation more interesting. Blocks by their nature imply building, growth, and playful energy. You can customize the color scheme of the blocks to best suit your presentation or brand identity.
Use a 3D Bricks Exploded View to Symbolize a Process
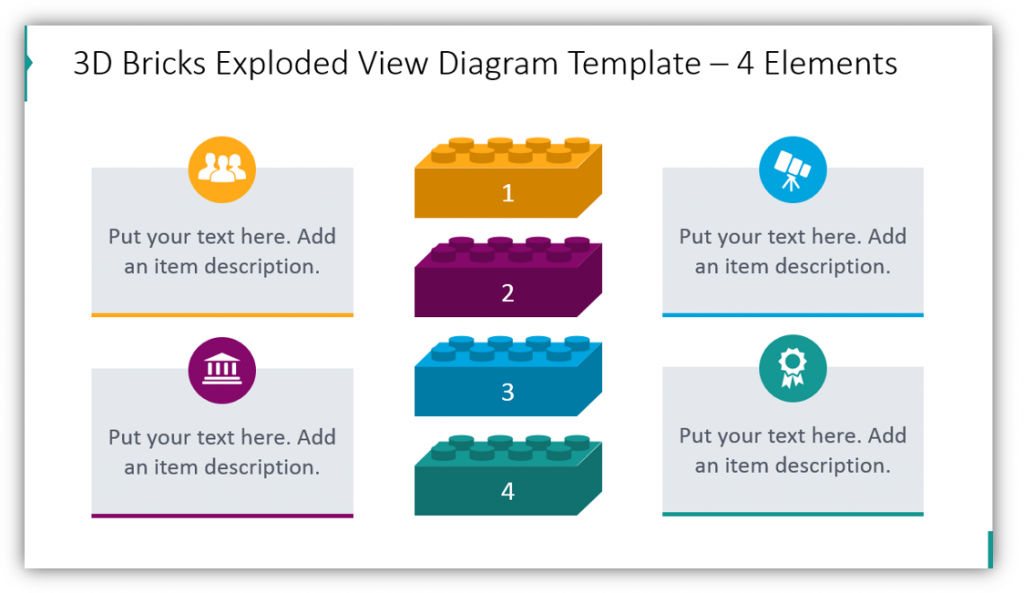
In this example, the blocks are separated but clearly go in a specific order. This can be useful for describing a sequence of events or process. Since building blocks like these already symbolize building, it’s not a stretch to associate them with progress. The slide will be even more effective once you’ve added your own icons to represent each step or block.
Use Brick Graphics Instead of Tables
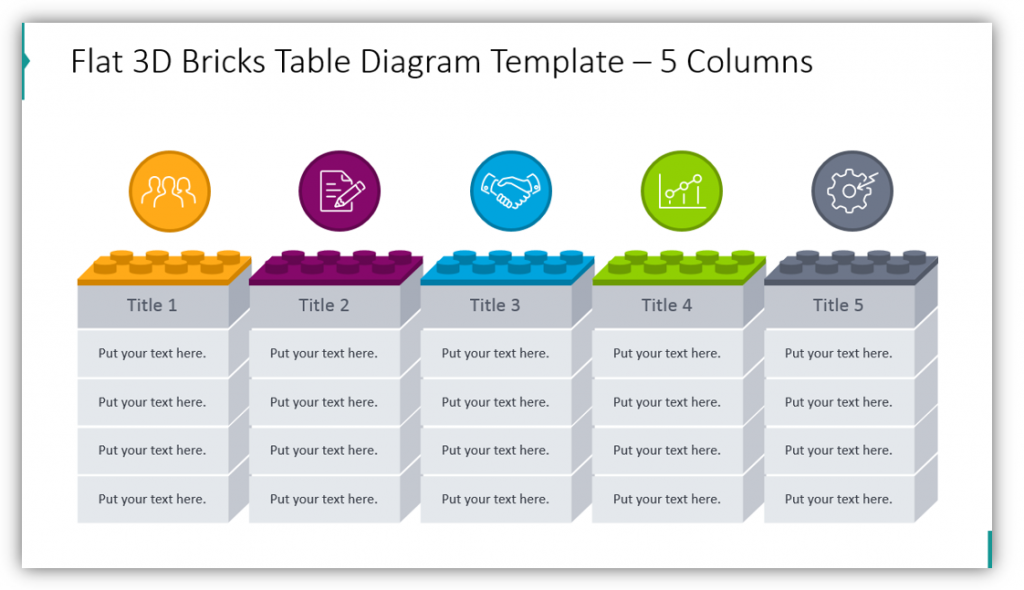
Need to explain something more complex than a 4 step process? You can still use plastic brick graphics! See how the bricks, when assembled into towers, serve as columns which represent different phases of a process or departments of an organization. Each brick represents one of many parts. You could use bricks to describe a product launch from concept formation and research to distribution, and only need to change the icons (if needed), descriptive text, and colors to suit your needs.
Build a Playful, Creative Matrix Diagram with Brick Graphics
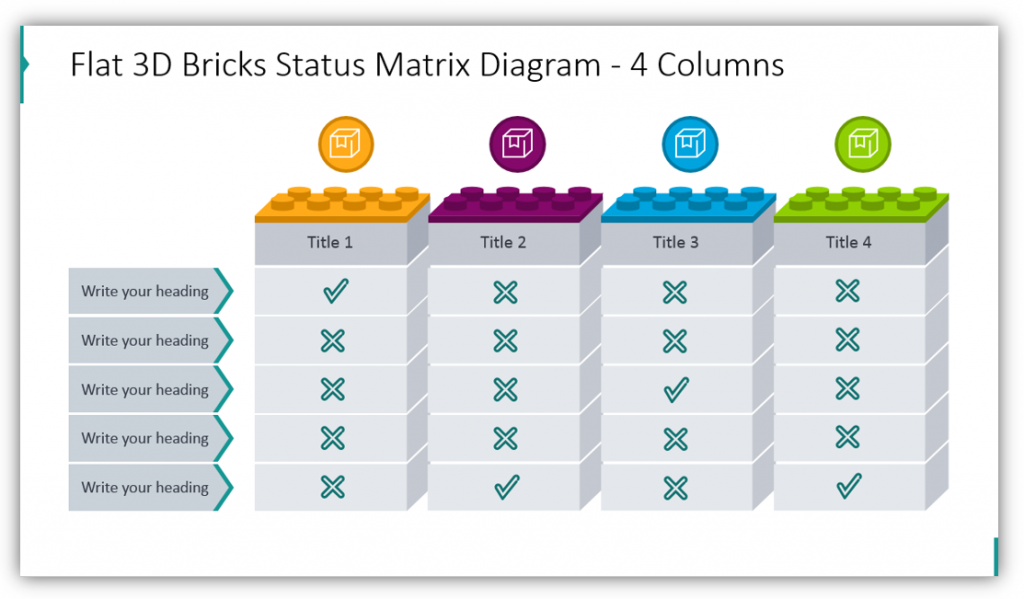
Matrixes don’t need to be boring! As in the last example, you can make as many columns as you need with block graphics. By adding labels for each row and using either an x or a checkmark when appropriate, you can easily build a visually striking, professional matrix diagram with block graphics.
Create Percentages Infographics
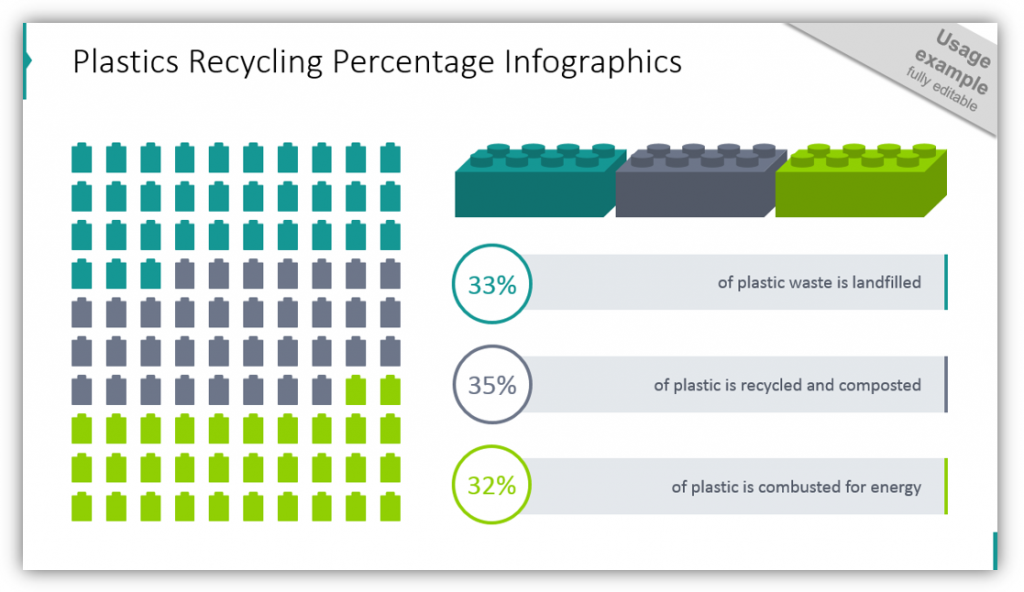
You don’t need to restrict your use of building blocks to steps, lists, or matrixes. You may use the blocks to build an infographic. Whether you’re showing the percentages of plastics recycled, as in the example, or the percentage of different products purchased by your customers – building blocks are a fun way to make the infographic visually appealing.
Use blocks in place of bullet points, instead of a table, to build matrixes, to create infographics, and even more.
Resource: 3D Bricks Graphics Blocks Diagrams
Sleek, modern, professional presentations are great, but sometimes you need to add some whimsy. Blocks which are 3D or 2D can be used for any of the purposes described here, but you may invent a few of your own. Since customization options are virtually limitless, your imagination can be, too! Creativity and out of the box thinking are sometimes just what you need.
Did you find the above examples useful? Check out the full set here:
Did you like this post, but think you might need more help? Check out the collection of infographic templates. The more you can customize your presentations and tailor them for your audience and the subject matter you’re presenting, the better your presentation will be.


