Use Gantt Chart Graphics to Present Your Project Plan
You want to present your project plan because it makes it easier to explain the overall schedule. You know it is important to demonstrate the timing of critical steps and how they depend on other tasks. You’ve learned that Gantt Chart tables are a visually striking, easy to follow way to present your project plans and they will help you set accurate estimates and manage your resources wisely.
Ways to use Gantt Charts
When you’re managing a project and presenting it, it’s essential to have clean and attractive visuals. Gantt Charts are great for showing the duration of activities with symbols and emblems to customize your presentations in order to make it more professional and cohesive.
Are you trying to present project timelines in an impactful way? We created this beautiful Gantt Chart PPT graphics set to help you create eye-catching presentations.
Explain your monthly project plan with a Gantt Chart
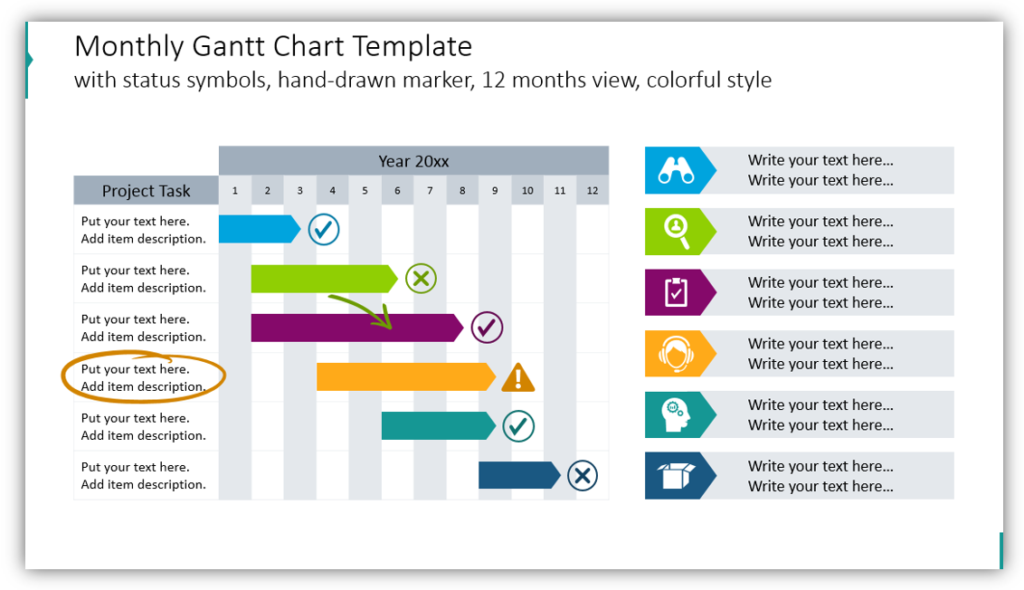
Use status symbols and customized icons to represent different categories of the task. Add supplemental descriptions in the boxes. By using a 12-month view you can plot out an entire year’s worth of projects for a single team or map out responsibilities for different departments. Add as many details as you would like for different project tasks, and remember not to overload slide with too much text.
Describe how projects will span multiple quarters
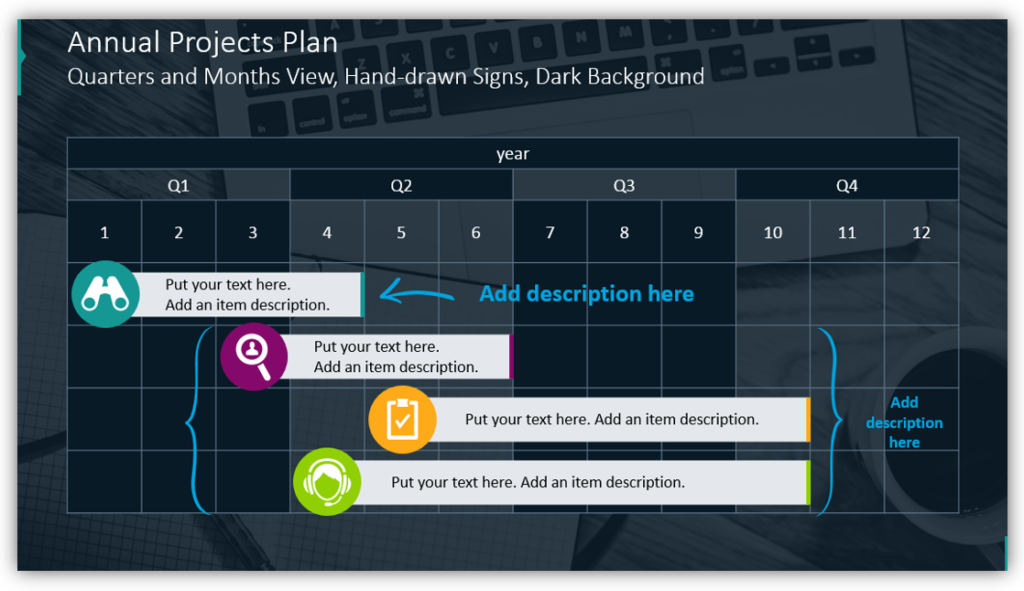
This view shows months and quarters in the context of the full calendar year. You can see how different projects span across multiple quarters. You can also show how different tasks overlap. You might continue the research and development phase into a product development phase.
Use a yearly schedule timesheet to further break down projects
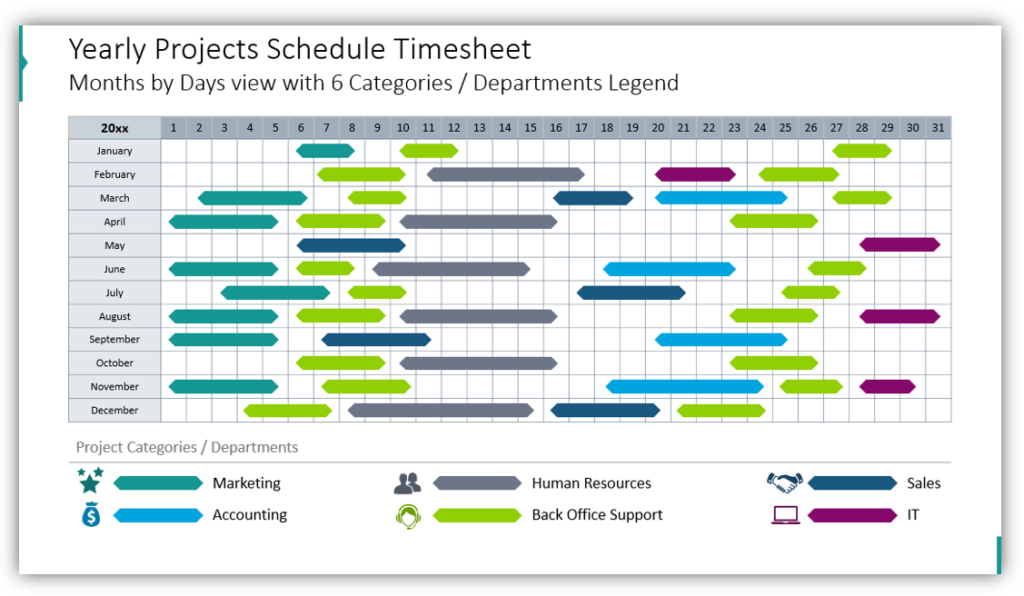
With a detailed, concise timesheet you can break down projects into months and days view. You can also show projects for numerous departments. Color-coding and adding icons to represent the different departments can help your audience follow your presentation and understand your message. With this graphics set, you can easily create slides that are easy to understand.
Present the status of in-progress projects using weekly Gantt Chart
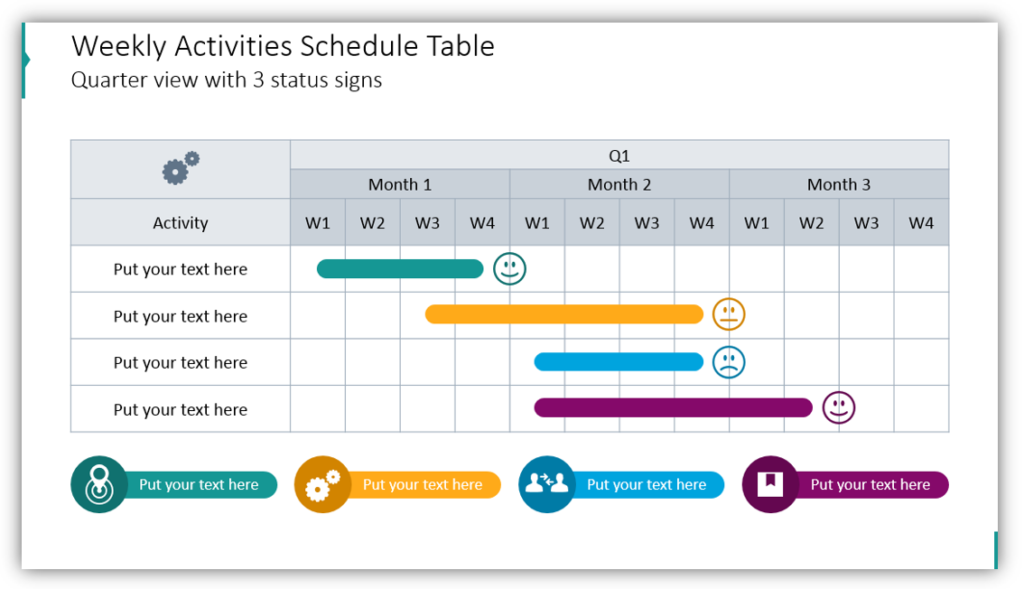
Provide details about scheduled activities and projects with a weekly activities schedule. Color coordinates the categories of tasks or activities. Mark their status with icons. In the example, we use smiley faces to represent project status. Completed tasks get grins, in-progress tasks get a neutral face and projects which are late on time to begin to get sad faces. You can choose icons that are appropriate or meaningful to your target audience for a more customized presentation.
Share project milestones with pins and a calendar table
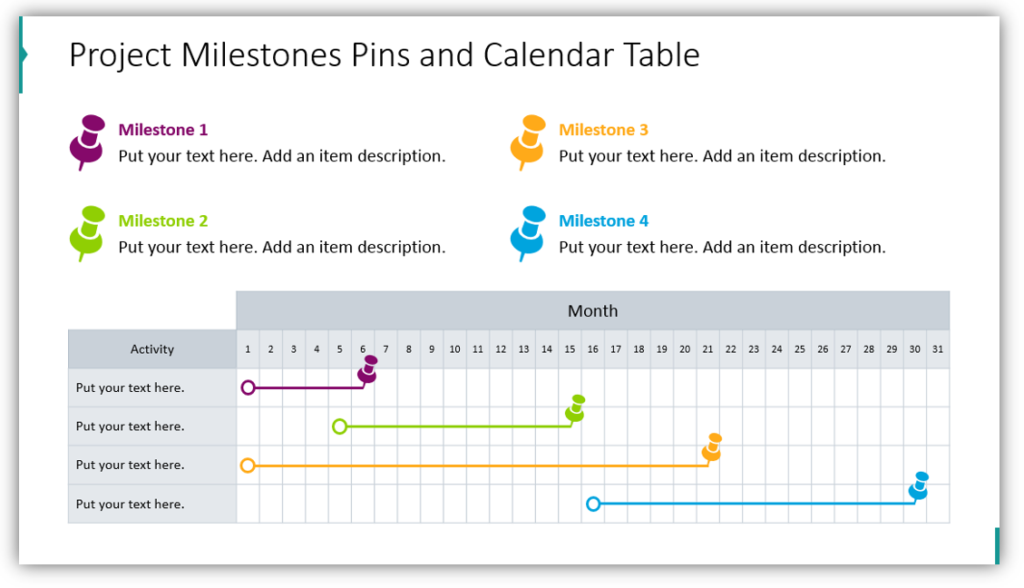
At the end of the year, you can share when projects started and put a pin in the month or day when the goal was achieved. That will help you evaluate projects and learn how to avoid mistakes next time. Mark progress and milestones so that you can put your ideas together in a simple, user-friendly way. Match the colors to the departments or projects you’re working on, and provide descriptions and labels for each one.
If you want to utilize eye-catching graphics and articulate your plans clearly, consider the benefits of a consistent graphic set.
Resource: Gantt Chart Graphics for Project Planning
Use a visual representation to better present task distribution over time. Save yourself the hassle of building diagrams with rectangles and creating your own timeline table. Focus your audience’s attention with professional, functional graphics.
Shift away from boring tables. Communicate full ideas with graphics and images. To add more variety to your presentation, consider adding modern charts and diagrams to your next presentation.


