Traffic Light Graphics for Project Status Presentations [RAG Templates]
Present project updates clearly with traffic light RAG status graphics. Ready-to-use red, amber, green PowerPoint templates for dashboards and status reports.
Visual metaphors are powerful. If you saw a traffic light with a red indicator, what would you think to do? Stop. A green light on a traffic light similarly would mean to “go” or “proceed”. The association of go and stop with the different color indicators on the traffic light creates a strong visual metaphor. You can harness that power for your next project planning and management presentations.
Elevate your business performance presentations with our curated resources – visit our financial performance PPT reports webpage.
Using simple, easily recognized symbols will help your audience follow your presentation.
See how Red Amber Green (RAG) traffic light graphics for PowerPoint can be used in project management and other presentations.
How can you use RAG traffic light graphics in presentations?
1. List factors with traffic light graphics
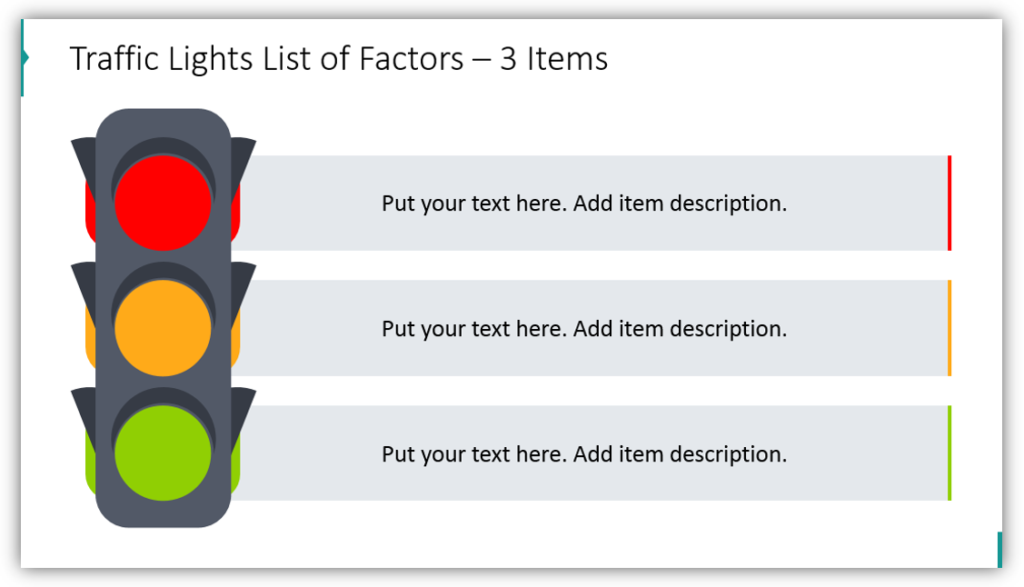
The red light, amber light, and green light can each be used to represent a different factor. Adding descriptions of each factor into the boxes will set the stage for you to begin your explanation.
2. Explain strategy milestones or statuses
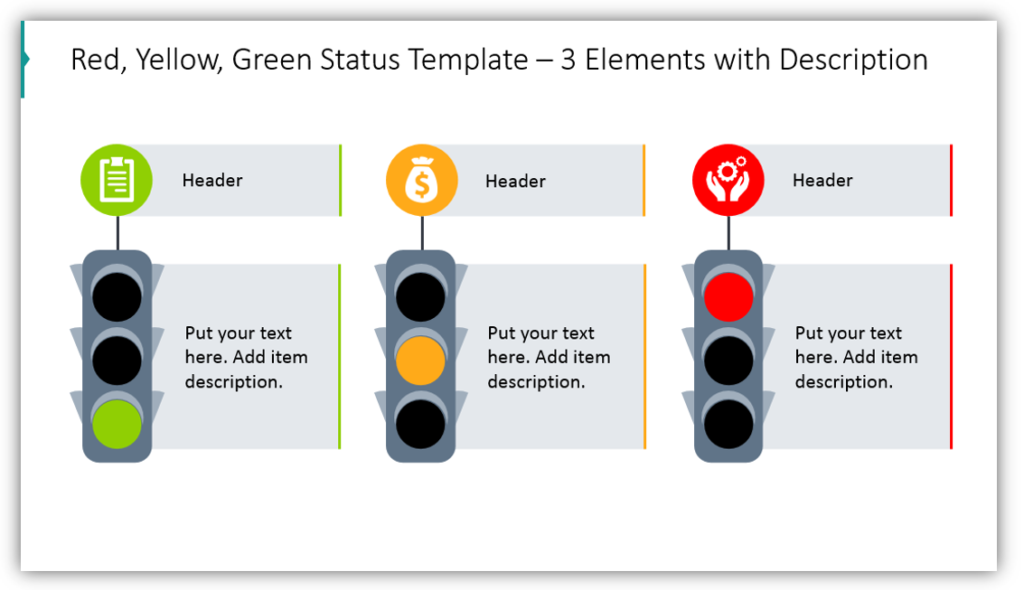
When describing the company or department milestones, you can put RAG traffic lights to good use. Red, symbolic of stopping, might indicate that a project or milestone is not yet moving forward. In that scenario, amber might indicate that a project or phase is in progress. Green would be the color used when a step or project is complete.
3. Describe milestones or statuses using tables and the RAG color scheme
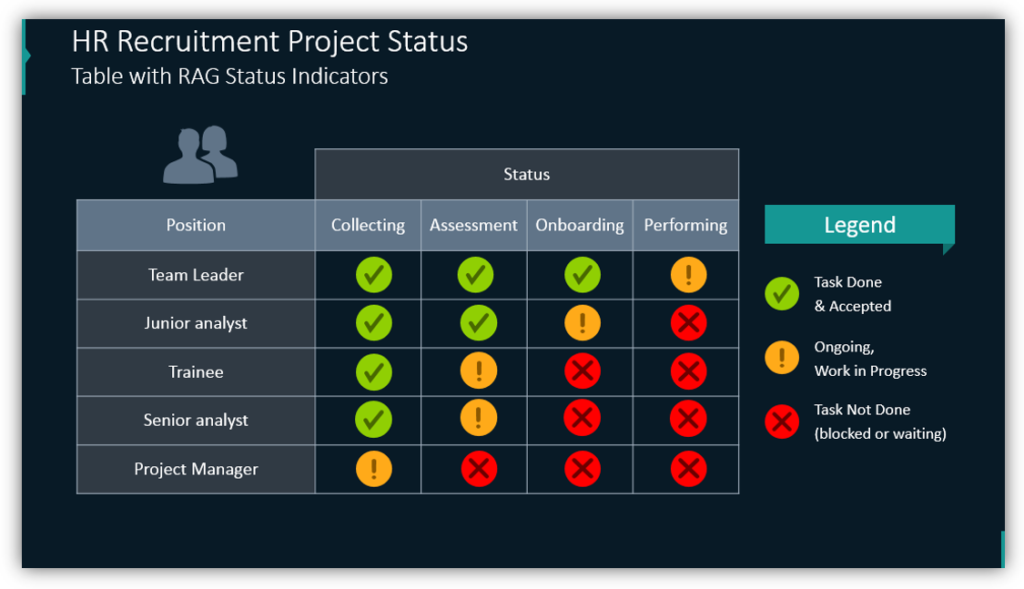
If you have many different departments, projects, or phases, you can utilize the power of the traffic light visual metaphor in a table. Use other symbols and the same red, amber, and green color scheme to make your points.
4. Share process status lights as a pipe intersection
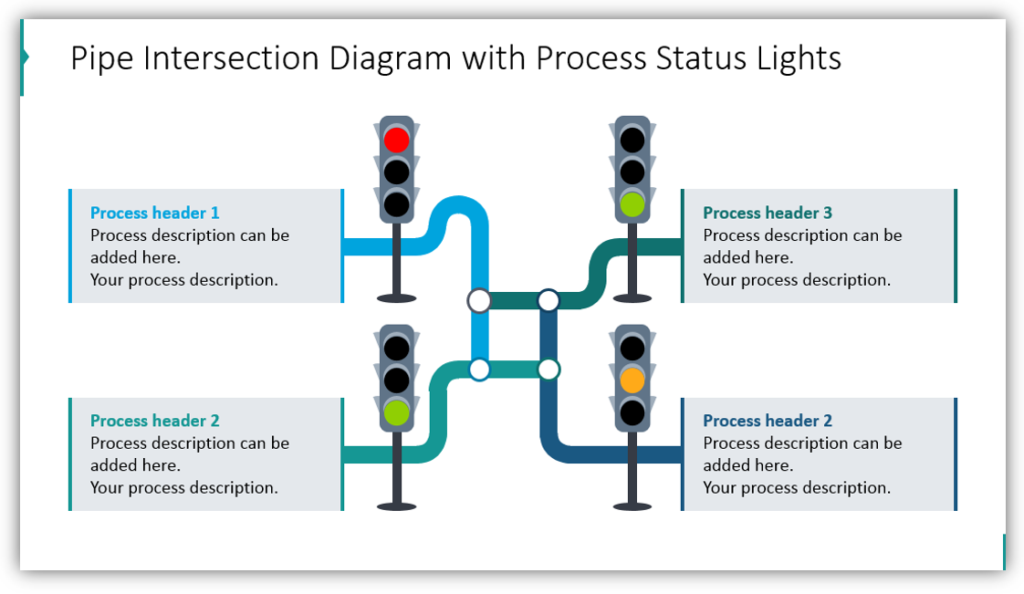
If you would like to present related processes, a pipe intersection diagram is a great choice. You can customize the colors of the pipe pathways to suit your needs. Choose the color of the lights to match the status of each process. Add a label for each process and include as much or as little detail as you’d like.
5. Present your strategy as a roadmap
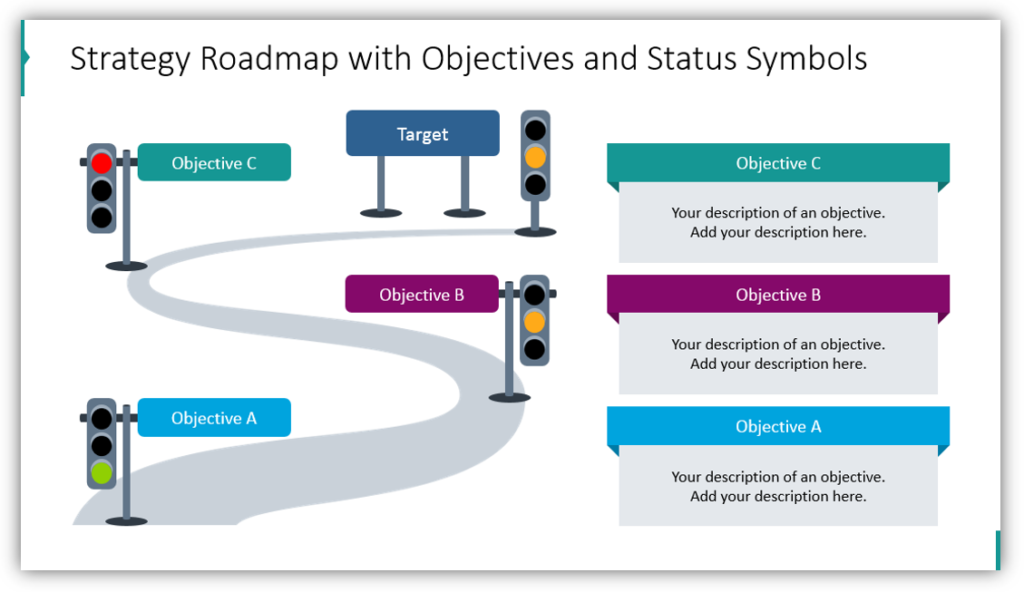
It is only appropriate to show RAG traffic lights in their natural habitat, on the road! In this example, you see how you could show the status of each objective. The roadmap allows you to give a more linear structure to the objectives, unlike the pipe intersection example. You can add additional detail to the description boxes. Be sure to include your final target!
Make project management presentations more coherent
Easily recognized symbols and graphics drawn in a modern, visually appealing way are sure to help your audience follow along. Don’t rely on boring tables and text-only slides when you can use new, eye-catching visuals.
Check our video guide on how to show progress with traffic lights step by step:
Resource: Status Traffic Light RAG Table Graphics
Keep your audience awake and informed by using engaging graphics. With simple graphics, your slides will pop without looking cluttered. Cohesively articulate your ideas for your audience.
Check out the full Traffic Light RAG Table Graphics set here:
Use innovative visuals for abstract ideas. Want to add more variety to your presentation? Add diagrams from flat infographic templates design bundle.


