Make Engaging OKR and Performance Review Presentations
Does your organization conduct performance reviews? Probably so. Even if you don’t utilize OKR methodology for your performance reviews, you might still need to present one. A performance review can be of individuals, teams, projects, or even the company at large. No matter the size of your audience or the subject of your presentation, having easy-to-customize illustrations will help you explain complex data, ambitious goals, and your achievements.
Explore our Business Performance PPT Reports category on the website for more resources to boost your presentation impact.
Creating PowerPoint slides with visualizations and infographics will help you explain your data and objectives in clear, creative ways.
In addition to helping you present the findings of a performance review, these OKR Objectives and Key Results Performance Review graphics are helpful for training new staff. Explain the OKR methodology or your Performance Review process to new hires with ease.
Explain OKR by Defining the Terms
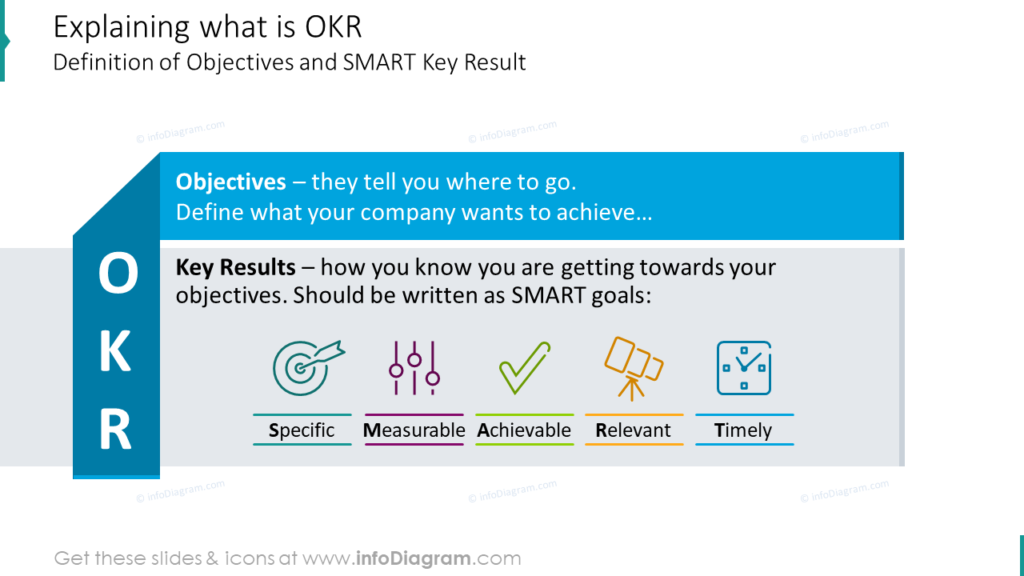
To establish context and ensure all members of your audience are on the same page, consider adding a definition slide. It is important to remember who your audience is and their level of comfort with and fluency in the topics and terms you’ll be dealing with the topics at hand. If you are teaching OKR methodology to new hires or staff which are unfamiliar with the topic, a definition slide like the example is absolutely necessary. The icons utilized, colors chosen, and text can be modified to suit your needs. However, if your audience is familiar with OKR methodology or you are presenting a quarterly performance review update, a definition slide may not be necessary.
Establish Your OKR Criteria
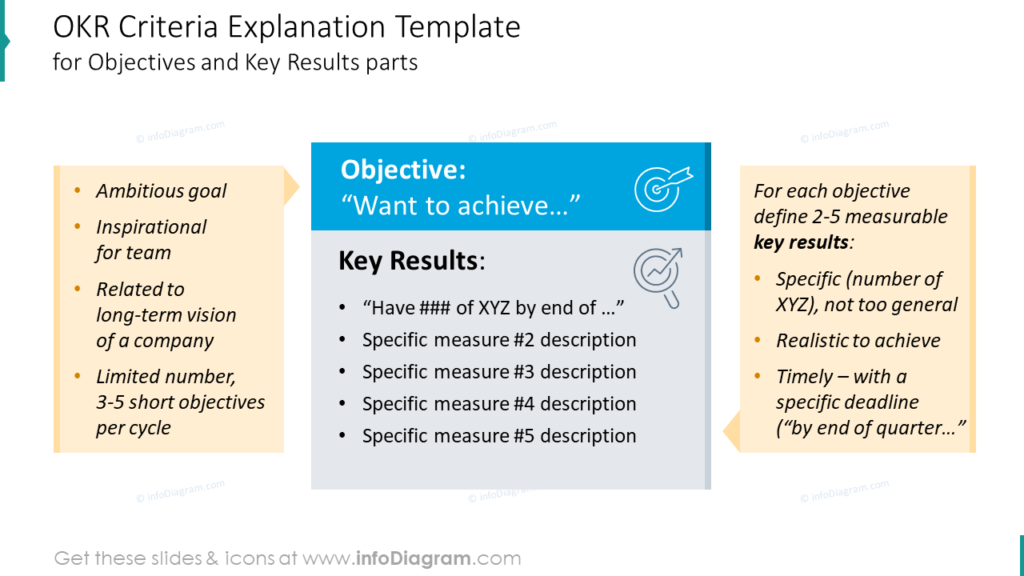
For clarity, make sure your audience understands the OKR criteria. It’s important they overall understand what the terms “Objectives” and “Key Results” are. However it’s also important they understand what each Objective is, and what Key Results looks like. Saying “we achieved our goals” means nothing to an audience if they do not know what your goals were. Again, consider your audience and provide as much detail and explanation as you believe they will need.
Establish the Timeline of the OKR Setting Process
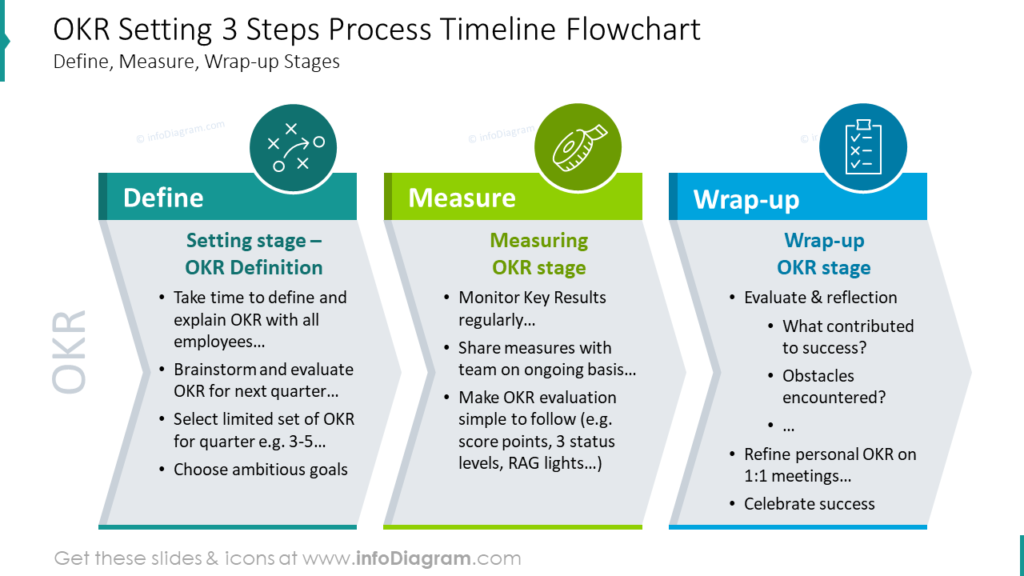
If your presentation is meant to establish a Performance Management program or describe how your audience might establish their own OKRs, committing a slide to the OKR process timeline would be wise. Think about who you will present to. If your presentation is being made to people who are familiar with OKRs, would they still benefit from a timeline explanation? Edit the colors, icons, and text to suit your needs. If you need to explain another process, rather than an OKR timeline, as part of your presentation this chevron template may be helpful.
Engaging, Colorful Diagrams are Better for Illustrate Your Performance Review Than Boring Tables
Dull tables can make presentations boring or confusing if the topic of your presentation is dense or complicated information. Don’t make your audience wade through cells of data if you can make your slides easy to follow diagrams and infographics instead! Of these two slides, which is the most interesting? Which is the most engaging? Which is the most memorable? It is no contest.
Here are a few quick instructions to help you create OKR process diagrams for your own presentations:
- Instead of a table, use text box shapes and fill them with your content.
- Change the text boxes into arrows to show the OKR process flow. Add depth by adding additional, darker shapes.
- Customize your slide look by changing its colors and adding icons.
Check our video guide on how to redesign OKR’s Business Goals step by step:
Resource: OKR Objectives and Key Results Performance Review
Whether you are presenting a performance review, sharing the results of a performance management project, or explaining OKR methodology, modern visuals will help your audience follow and understand your message. Articulating your message clearly and concisely is easier when you can use meaningful graphics in your presentations. Click here to check out the full OKR Objectives and Key Results Performance Review Set:
Attractive and easy-to-understand graphics will help your audience understand your presentation, therefore allowing them to ask better questions and absorb more of the material, especially when you discuss goals and team performance.


