Create Change Management Presentations Using Lewin’s Model PowerPoint Graphics
Do you have trouble presenting organizational changes? Sometimes the reason a business change management presentation falls flat is because in general, people are resistant to change. That is out of your control. One other reason PowerPoint presentations fall flat is because of dull slides with default tables and bulleted lists. You may only get one chance to capture your audience’s attention and imagination, so make it count!
Do you use icons and graphics in your presentations? When deciding how to make eye-catching slides, do you think about what frameworks could help you make effective points? Click here to see the full Change Management Diagrams: Lewin’s Model graphics.
Use Graphics to Define Terms from Lewin’s Change Management Framework in Presentations
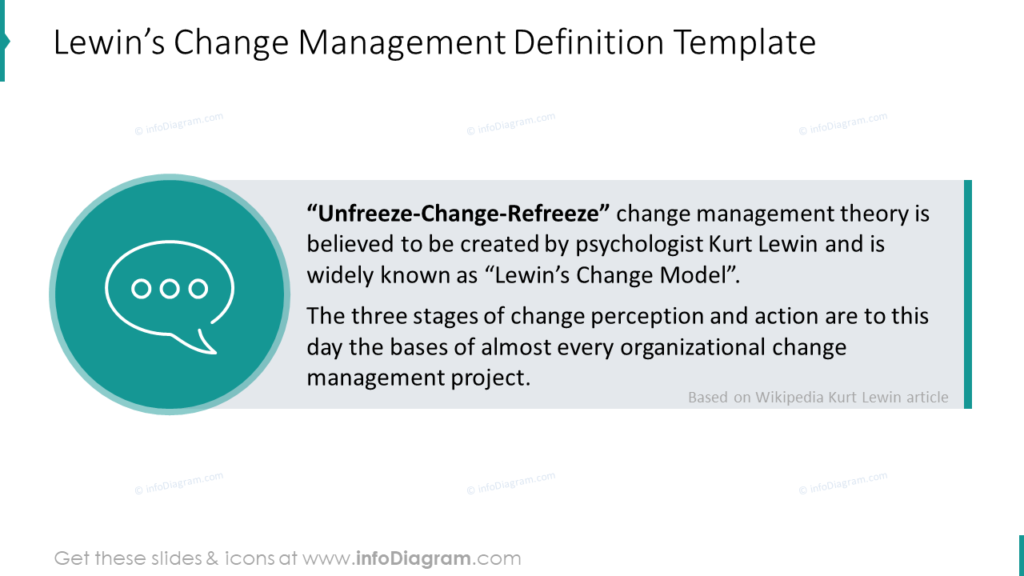
Why use icons and visuals at all? In addition to making your presentation slides more visually appealing and attention-grabbing, graphics can help your audience understand unfamiliar concepts. There are still usually a few terms you need to define to be able to point a complete, thorough picture. You can also use these graphics or similar ones to present relevant quotes about either the business change itself or the process.
Create PowerPoint Slides with Kurt Lewin’s Change Model Diagram as a Water Cycle
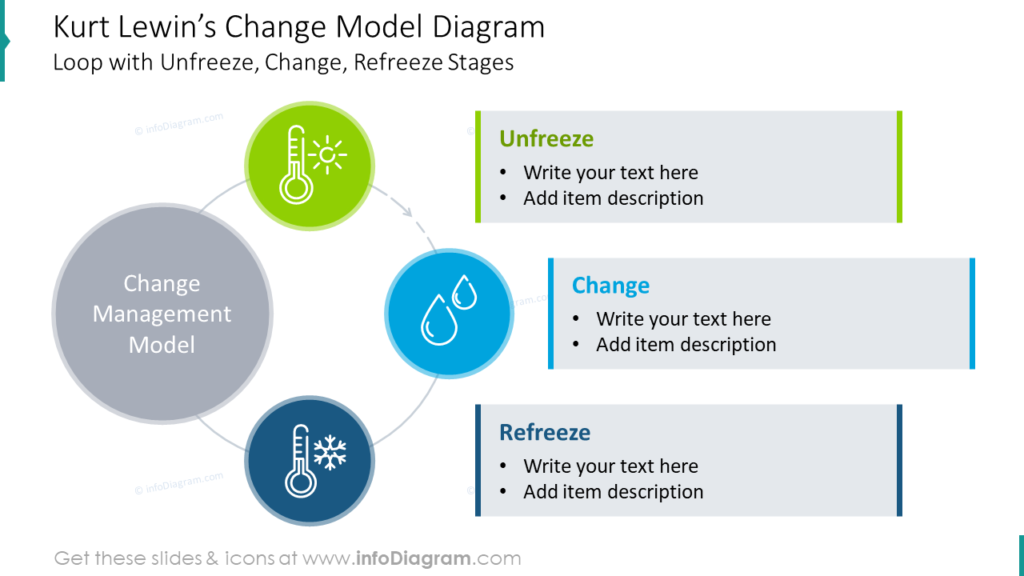
If you’re worried about your audience not understanding your change management presentation, consider using a visual metaphor. A great metaphor for Lewin’s Change Management Model is a water cycle with Unfreeze, Change, and Refreeze steps. These may also be thought of as the “Plan,” “Action,” and “Result” phases.
Use Reshaped Elements to Represent Change
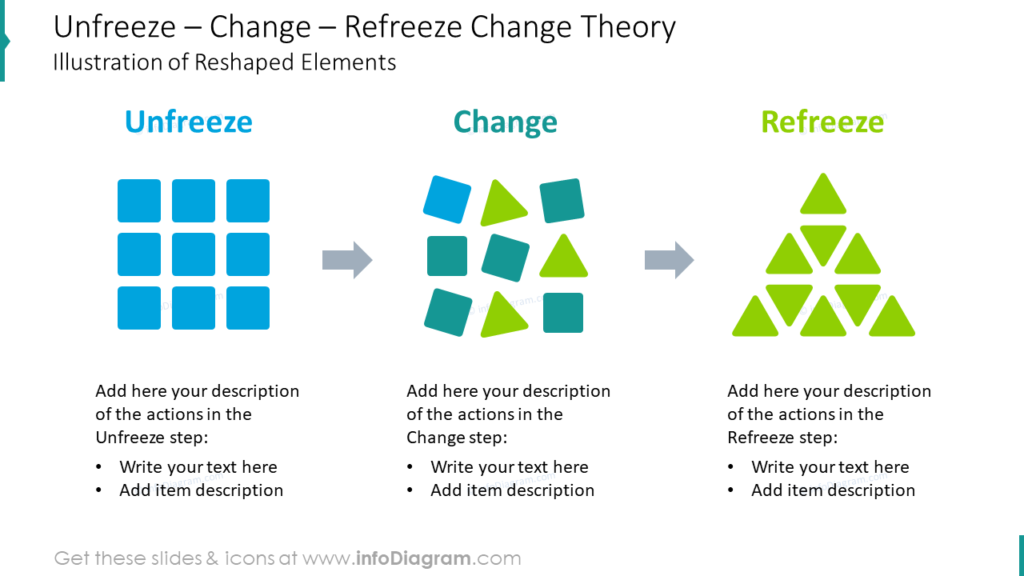
Don’t be afraid to get creative! Using a water-cycle based loop to represent change is just one of the ways you can present a change management process. The example slide, which is included in the Change Management Diagrams: Lewin’s Model icon set, utilizes shaped elements. See how the “Unfreeze” stage looks? Notice it also provides you with plenty of space to customize text to better share your message? The “Change” visual shows the transition between the “Unfreeze” and “Freeze” stages.
Make an Eye-Catching Flow Chart to Present Lewin’s Model of Change Management
Step-by-step guide on how to show Lewin’s Change Model action list metaphorically
- Divide your content into 3 columns. You can skip using a table if you space your text evenly.
- Add a rectangle shape with circles to make a timeline. Customize the timeline by adding icons or numbers.
- Make your slide colorful to make it even more attractive and interesting.
Resource: Change Management Diagrams: Lewin’s Model
We created the Change Management Diagrams: Lewin’s Model graphic set to help companies and organizations give more effective presentations. Get the full slide collection here:
Using cohesive graphics can help tie a presentation together. Our designers believe that with the right icons and diagrams you can articulate your thoughts more clearly. Why use boring tables and lists? You don’t need to use confusing, dense slides with large blocks of text if you can utilize easy to customize, consistent graphics.


