Present Your Customer Experience Strategy With Graphics
Do you need to communicate a new customer experience strategy to your team? Many professionals and businesses have learned how important customer experience is to success and your bottom line. If you need to train new hires on your customer experience processes or strategy or give a presentation to explain why CX is important, pre-designed compelling visuals can help you. We hope our Customer Experience Management Strategy graphics and examples can inspire you.
Elevate your business performance presentations with our curated resources – visit our financial performance PPT reports webpage.
Is customer experience one of your top priorities? Make sure your customer experience strategy presentations show that with engaging, professional PowerPoint graphics. Click here to see the full Customer Experience Management Strategy Processes PPT diagrams set.
Present your customer promise strategy
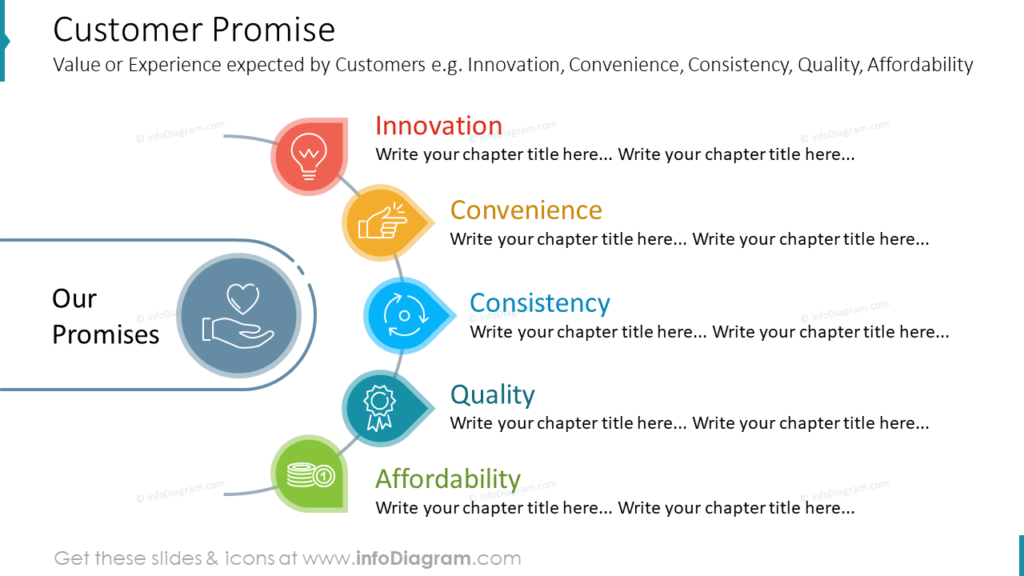
What value do your customers expect? Your customer promise, what value or experience is expected by customers, is an important part of your customer experience strategy. The promises may fall under innovation, convenience, consistency, quality, affordability, or other measures. The example slide shows several potential promises your business, brand, products and services make to your customers. This slide is a unique alternative to boring text slides with basic Microsoft Office bullet points. The colors, icons, and text can all be modified in PowerPoint using basic editing tools so you can tailor these eye-catching visuals to your audience, so you don’t have to worry even if you are a beginner and not to familiar with PPT design.
Describe your customer journey with infographics and icons
Understanding your customer journey is an essential part of customer experience management and strategy. The example journey features an online store example which is broken into site visit, order creation, checkout, payment, order tracking and delivery steps. By illustrating this process, you are giving your audience insight into your client experience. This flow chart can be edited to match your customer journey. Be mindful of how much text you decide to add for each step. This will keep your slide from becoming too wordy and overwhelming for your audience. Don’t forget, you can use these flow charts to explain any step-by-step process, not just your customer journey.
Tie it all together with a customer experience strategy process
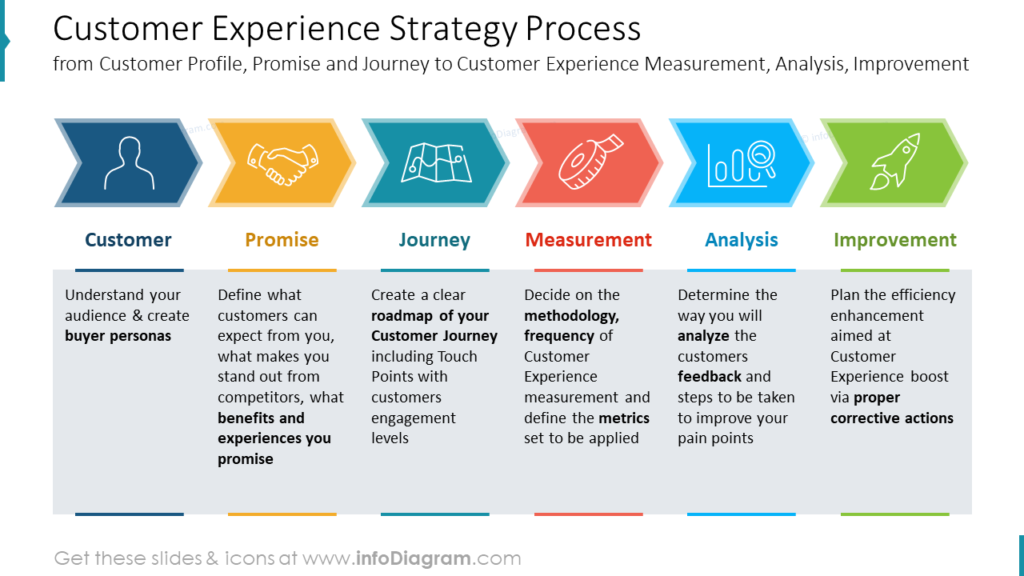
After you have defined any unfamiliar terms, what your customer promise and journey look like, and how you will monitor and measure customer experience, you should tie these points together. The example diagram shows how a customer experience strategy process infographic can help explain how the different CX parts fit together. The steps included are the customer profile, promise, journey, as well as cx measurement, analysis and improvement. Notice how analysis and improvement are both included? For ongoing initiatives these steps may already be part of the process. If that is the case, graphics in the Customer Experience Management Strategy Processes set to help. If your presentation is for a new CX initiative or for new hires, you may instead be explaining how the analysis and improvement phases will work in the future.
Make your customer experience processes and terms presentation original
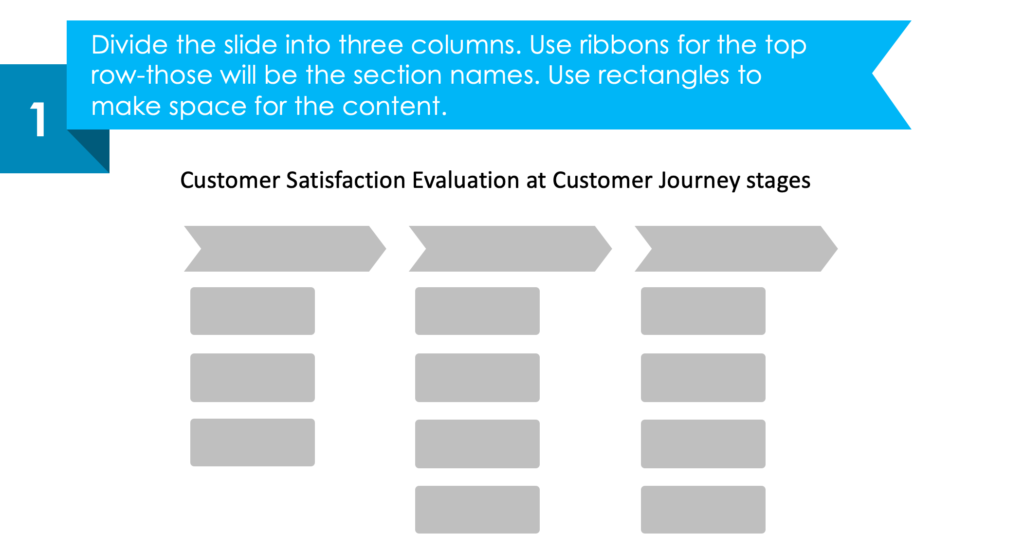
Is your customer experience process presentation dull and forgettable? If your slides rely on unattractive text and bullet points, you may find it hard to keep your audience’s attention. Follow these steps to create a readily digestible symbolic infographic slide instead.
1. Divide the slide into three columns. Use ribbons for the top row-those will be the section names. Use rectangles to make space for the content.
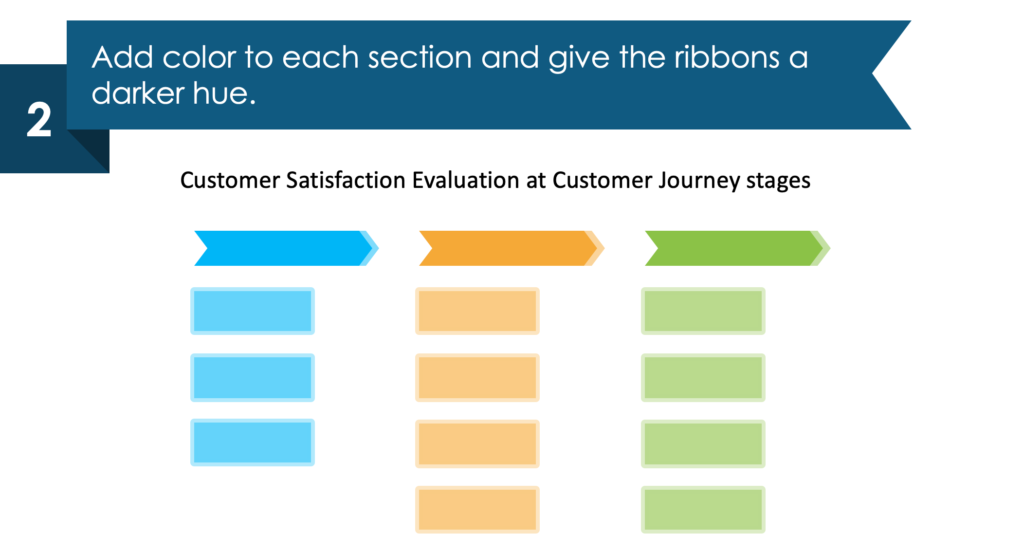
2. Add color to each section and give the ribbons a darker hue.
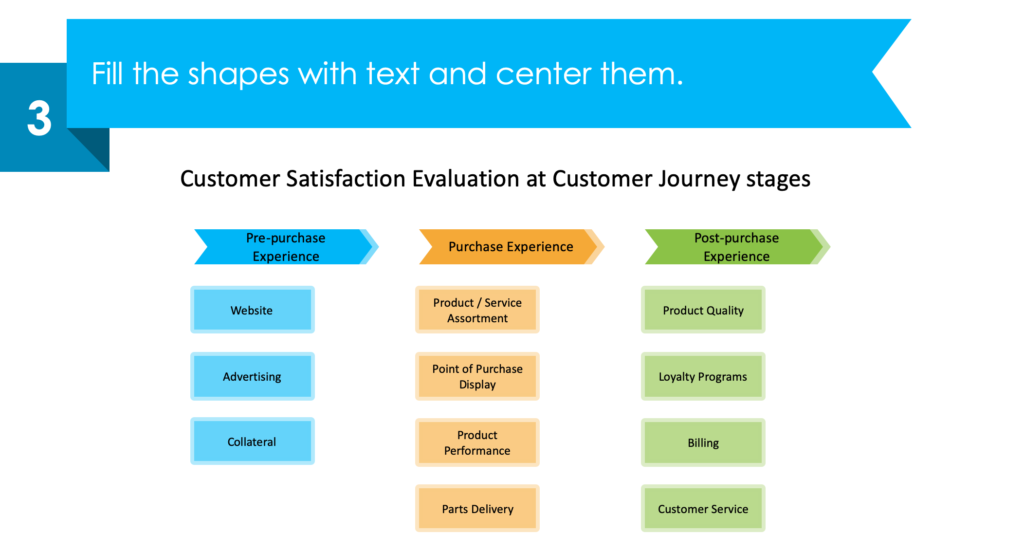
3. Fill the shapes with text and center them.
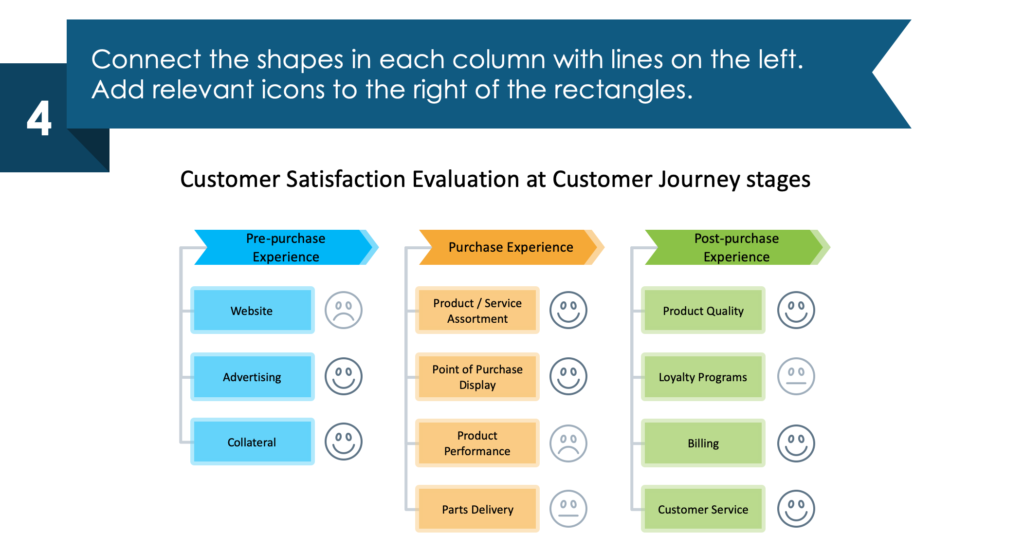
4. Connect the shapes in each column with lines on the left. Add relevant icons to the right of the rectangles.
Explore our YouTube channel for more creative inspiration:
Resource: Customer Experience Management Strategy Processes
Make sure your next customer experience strategy PowerPoint looks cohesive and professional by using pre-made graphics. Our designers created the graphics in this set so that everyone could have creative, and aesthetically pleasing PPT slides without special graphic design software or design experience. We hope these examples have given you inspiration for your next presentation.
With the Customer Experience Management Strategy Processes icon set, you can save time and create memorable presentations. If you want to make your slides really pop, check out the full Customer Experience Metrics Diagrams set:


