Annual Report Presentation: 6 Business Highlights Slide Ideas for PowerPoint
Present your annual report business highlights effectively in PowerPoint. See 6 slide examples for company performance, KPIs, and year-end results presentations.
Need to share information about your company performance and create a comprehensive overview of activities throughout the preceding year? Financial data and key business highlights can contain lots of content and be quite heavy text-wise. Make your annual report easy to understand by using graphs, icons, infographic elements, and data-driven charts.
Annual reports are intended to give shareholders and other interested people information about the company’s operations and financial performance. Prepare that report smoothly using our pre-designed structured slides.
All slide examples presented below can be downloaded as an editable source. Click here to see the Annual Report Company Performance Presentation for PowerPoint.
Get inspired by our visualization examples, which show how you can present selected six business and financial highlights compellingly.
Present the company at a glance and illustrate business highlights in the annual report
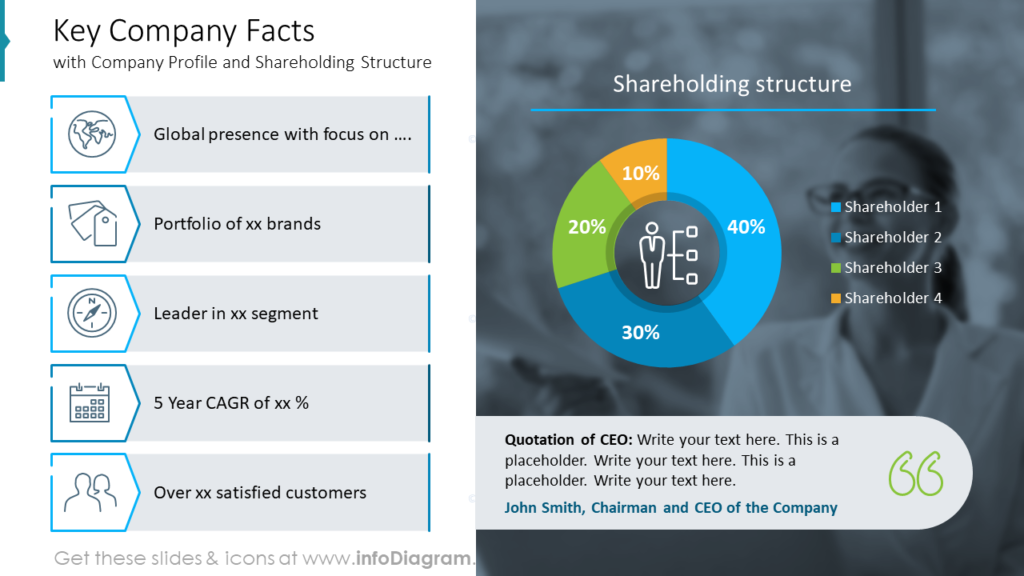
Start with outlining key company facts, like global presence, portfolio projects or clients, and satisfied customers. You can easily combine those facts with a shareholding structure pie chart and add a quote from the CEO if you’d like.
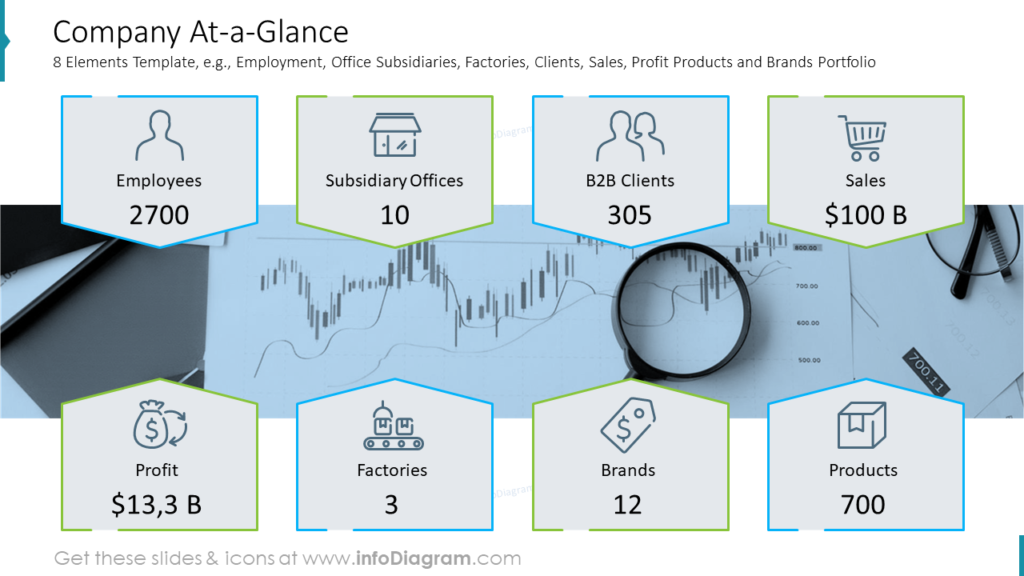
Alternatively, use another slide to show your company a glance. You can reuse this template, where we included such business highlights as employment, office subsidiaries, factories, clients, sales, profit products, and brand portfolios. Notice how each fact is illustrated with a symbol. We also added a neutral background picture, which makes this slide more attractive without stealing attention from the content.
Illustrate milestones in a roadmap
Choose the most essential events that influenced your company and show them using a timeline.
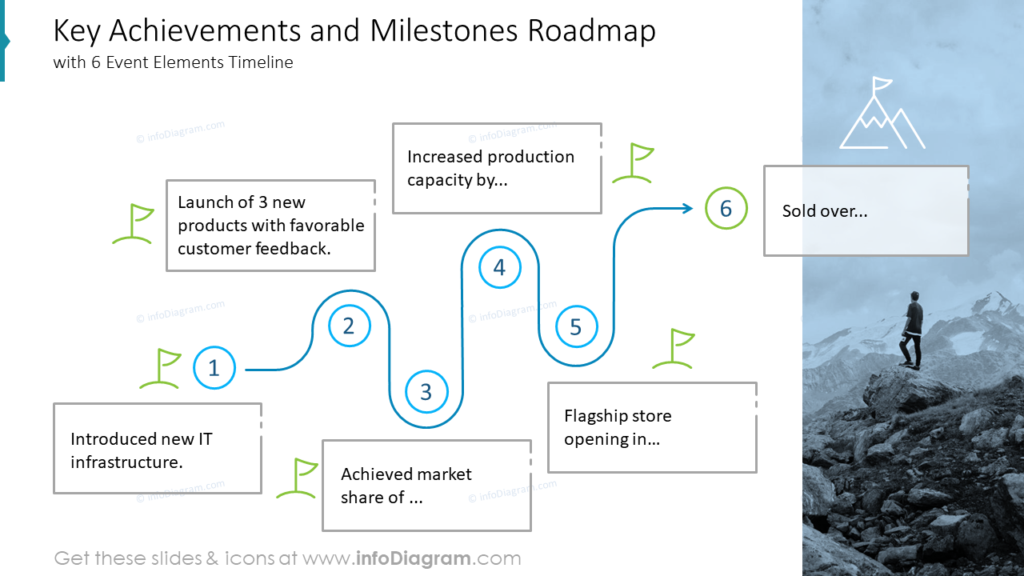
In the example above we illustrated six milestones: new IT infrastructure introduction, 3 new products with favorable customer feedback launch, market share achievement, production capacity increase, flagship store opening, and selling over. Each stage is shown with flags and there’s an icon of a mountain as a symbol of accomplishment at the last stage. You can optionally add an illustrative photo on the right or left side of the slide.
Include the top customers’ analysis in the business highlights of the annual report
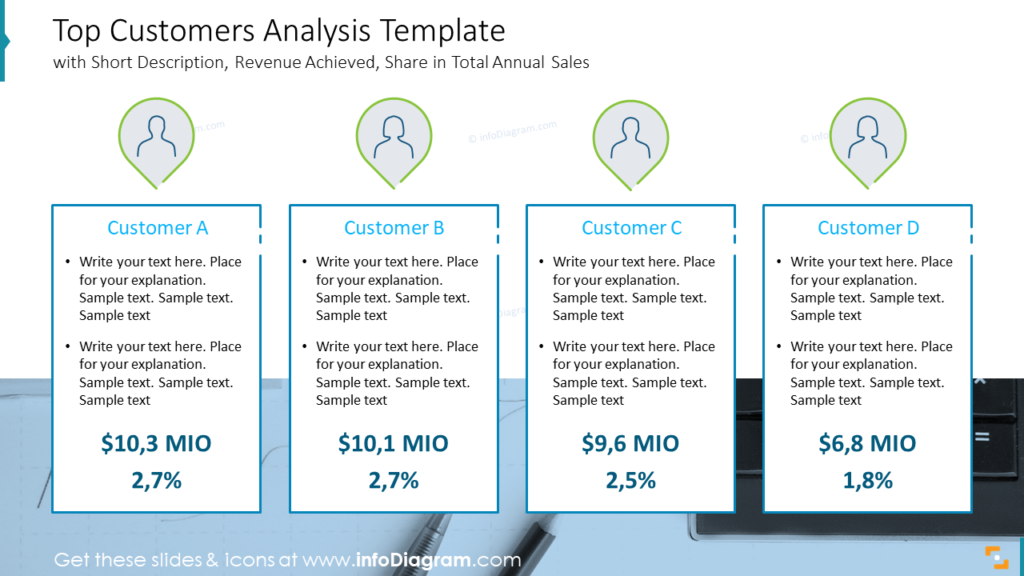
To recap your best customer profiles you can use a slide like above, containing a short description, revenue achieved, and share in total annual sales.
Focus your audience’s attention on figures. Consider increasing the font size and using a different color from other text.
Create revenue and profit snapshot
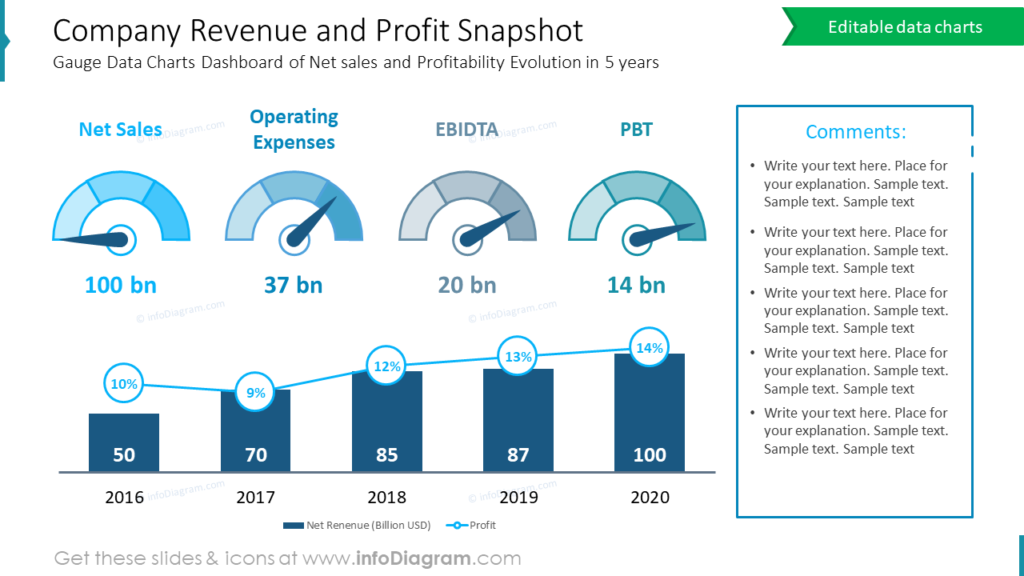
The company revenue and profit snapshot slide doesn’t have to be boring and contains lots of text information. We propose a creative way: use gauge data charts dashboard to describe net sales and profitability evolution in 5 years. We included the following indexes: Net Sales, Operating Expenses, EBIDTA, and PBT. You can reuse it to adapt to your needs.
If you look closer, this slide example includes much content, but it is designed in such a way that it’s easy to understand. You can also add your comments and observations aside.
Show next year’s outlook
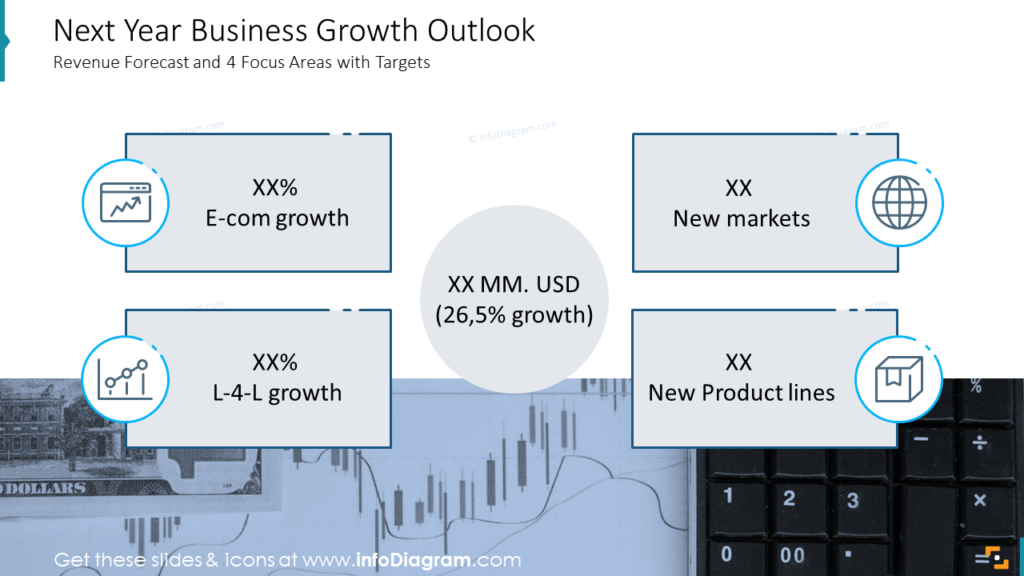
Illustrate your next year’s business growth outlook using a revenue forecast and 4 focus areas with targets slide. In our example, we focused on the following highlights: E-commerce growth, New Markets, L-4-L growth, and New Product Lines. Each point is illustrated with a suitable symbol. If you’d like to include more elements into the forecast, you better break it down into several slides, not to stuff one too much with the figures.
Create the balance sheet and cash flow statement readable
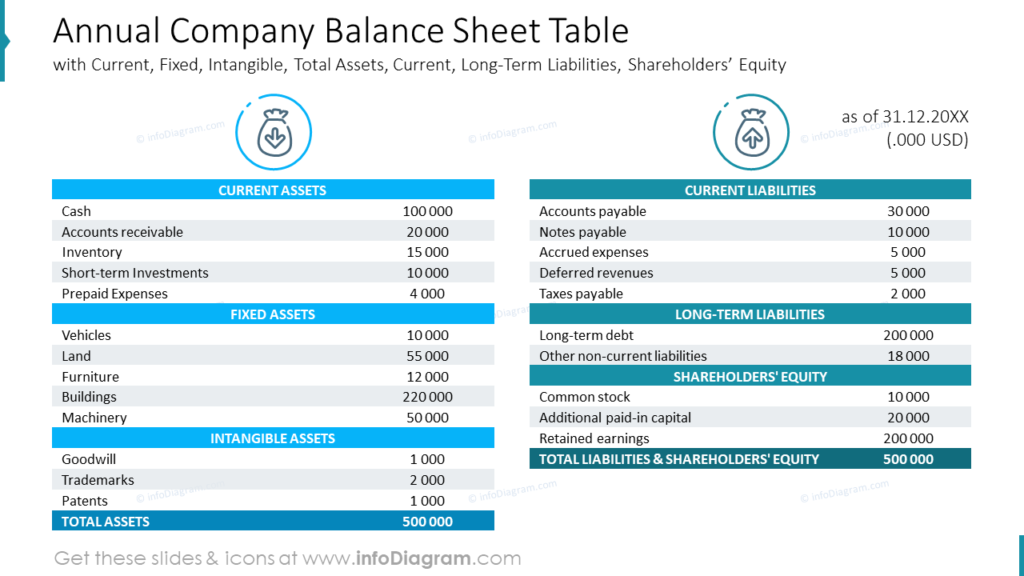
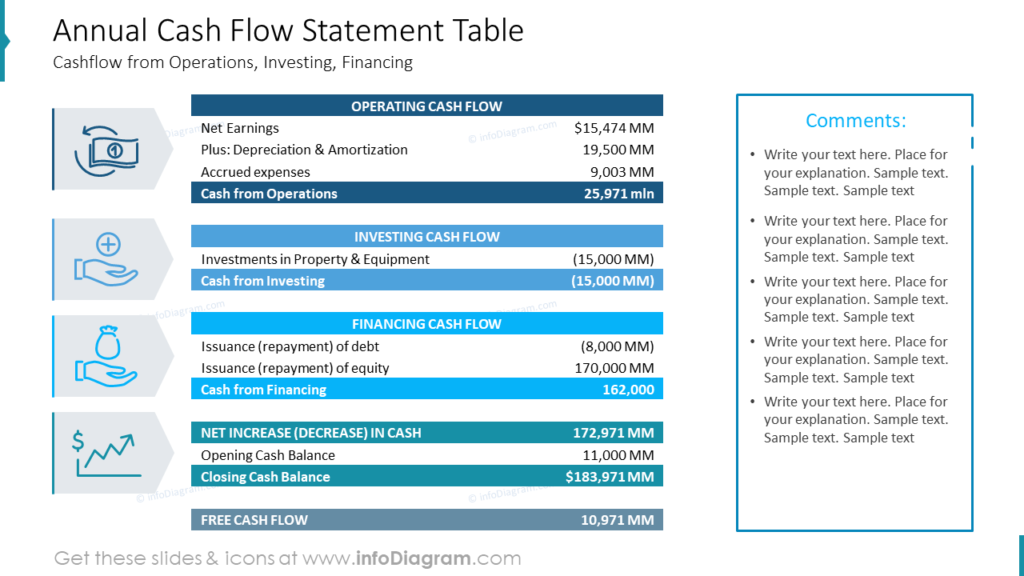
Such busy long tables usually don’t look good. Make a difference this time – try using such table templates with headers and icons. You can also include comments if needed. Current, Fixed, Intangible, Total Assets, Current, Long-Term Liabilities, and Shareholders’ Equity are the most common elements of the balance sheet, while cash flow from Operations, Investing, and Financing are a part of the cash flow statement.
Guide on how to visualize goals achievement summary slide
Check a quick instruction on how you can present a goals achievement summary as part of your business highlights using simple shapes, icons, and success/failure indications.
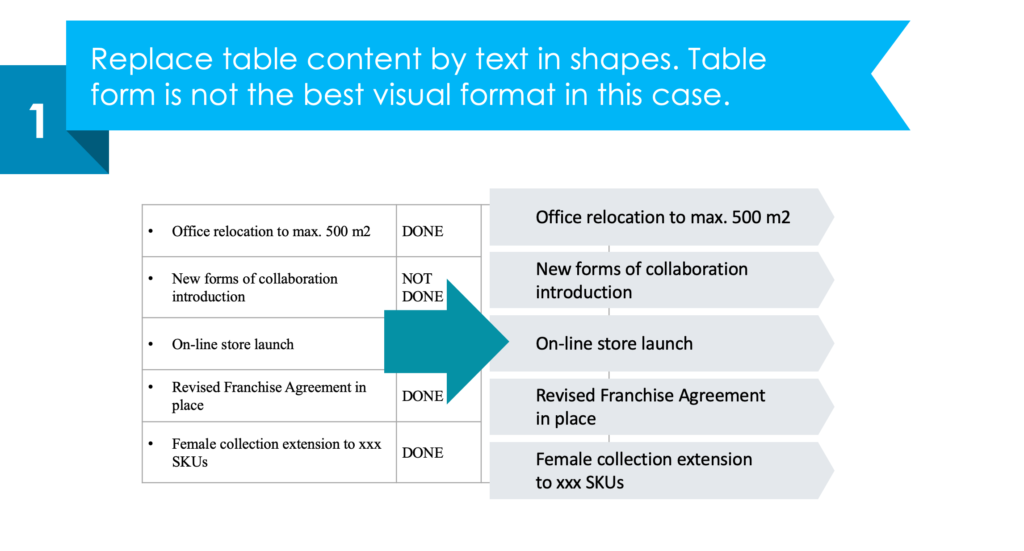
1. Replace table content with text in shapes.
A form of table is not the best visual format in this case. Using a PowerPoint shape looks better and is easier to edit, too.
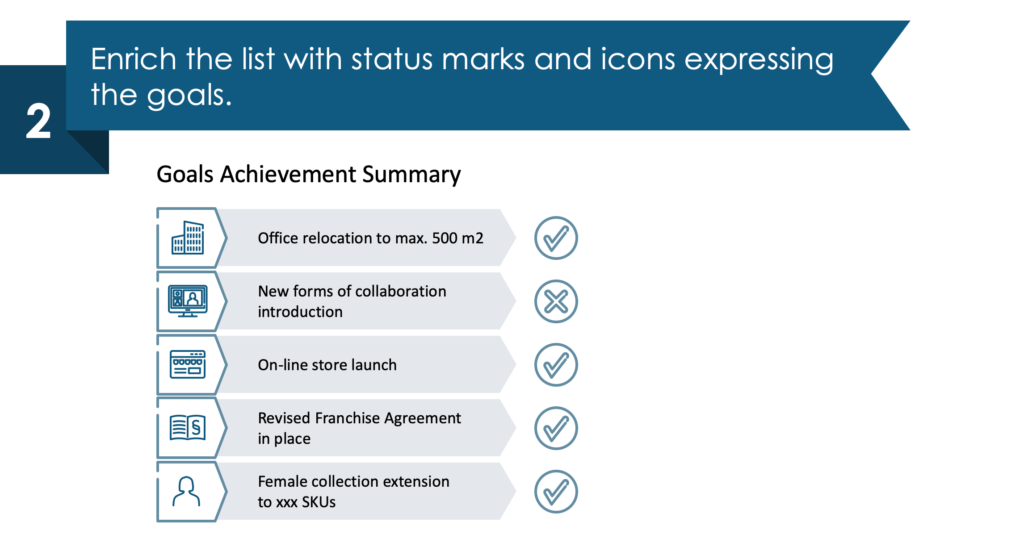
2. Enrich the list with status marks
It’s good to use a consistent set of icons expressing the goal’s achievement.
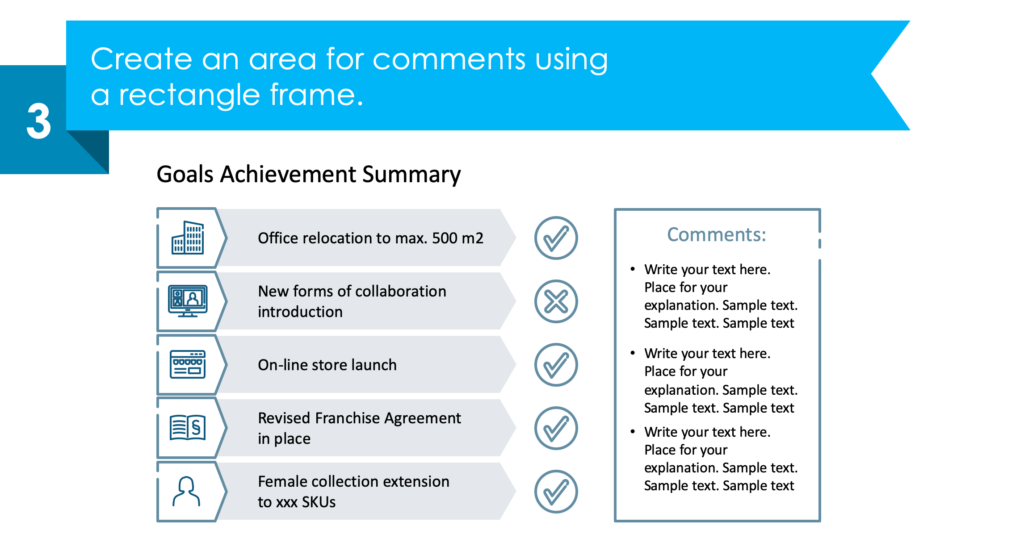
3. Create an area for comments.
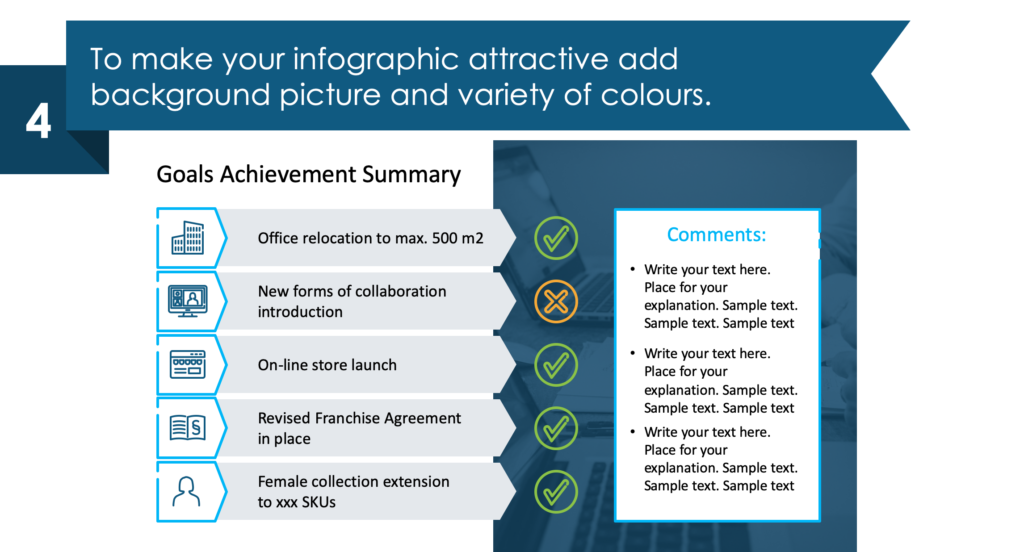
4. Make your infographic look attractive.
Add a background picture and color-coding supporting the meaning of Done and Not Done goals.
See the whole step-by-step guide and other examples here: How to Create an Effective Annual Report and Company Performance Presentation.
Resource: Annual Report Company Performance Presentation
The examples above are only a part of our annual report slide collection. Check our pre-designed annual report deck that incorporates key business highlights example layouts and financial data and present the data in a clear, informative, and visually appealing manner.
The majority of our slides have a space for your text/comments, so it is very easy to extend the presented ideas. We also included detailed instructions on how to alter the content, values, colors, and look and feel of our slides. See the full deck here:
More Design Inspiration
Check out our YouTube channel, where we share practical tips and before-after slide transformations like this:
If you need to focus only on the company’s stock performance and cover financial and sales information during your report, check our blog about visualizing stock financial annual report components.
Use modern graphics to create more consistent slides and communicate your ideas. Want to do even more customizing? Infographics from the collection of professionally designed editable diagram templates might help level up your PowerPoint presentations.
📩 Subscribe to the newsletter and follow our YouTube channel to get more design tips and slide inspiration.