Use Visual Templates to Present Stock Performance
Are you presenting your company’s stock report performance? Use these basic components to cover financial and sales information.
You can also include details about executive leadership such as board members and advisors. You can also provide details about office locations and basic legal information required for SEC reporting.
All example slides below are accessible in Stock Financial Annual PPT Report (see details by clicking the pictures).
Set the Stage with a Professional Title Slide and Agenda
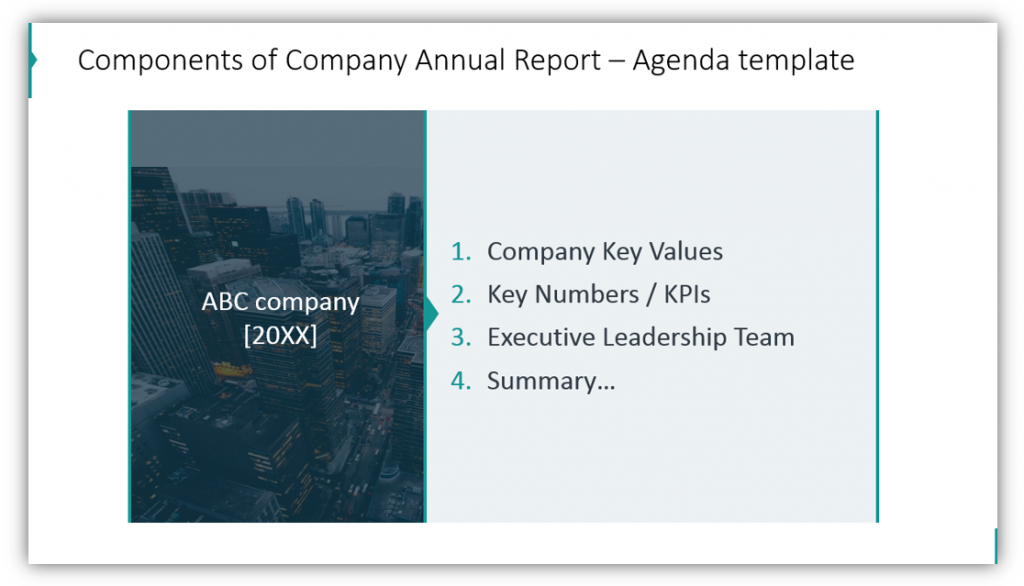
It’s important to have a title slide to establish the details of the presentation. You should also share the agenda for the presentation to minimize the number of early presentation questions and interruptions. The agenda should include the items you’ll be sharing in your report. You should also share the key company values, and main product sales which are responsible for your success. This will help remind your audience of what your company has accomplished and what you’re known to your customers.
Share Key Performance Indicators
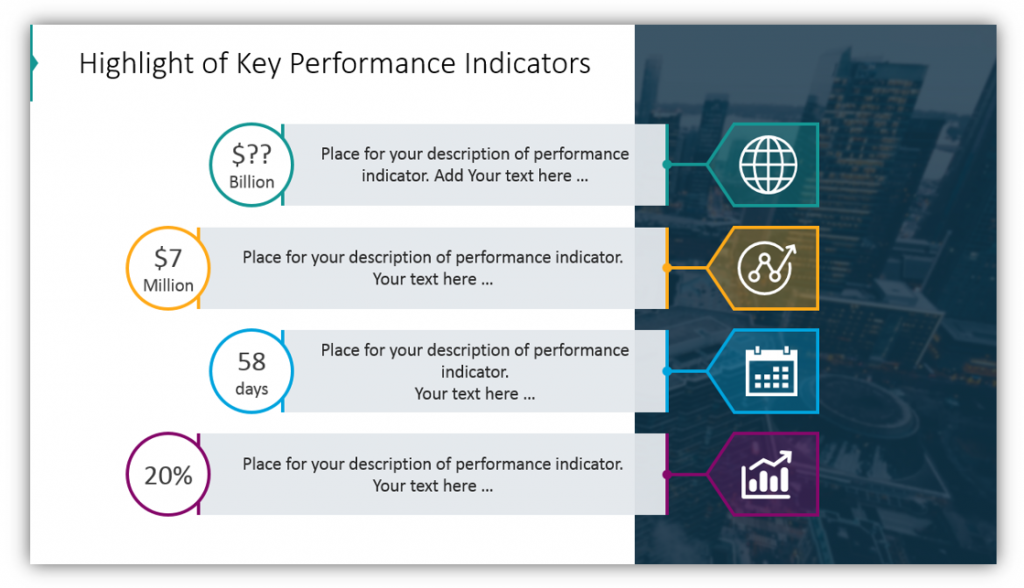
Use description boxes to label milestones and accomplishments. Use appropriate icons to help differentiate performance indicators by category or type. Whether you met an impressive sales figure goal, grew by a noteworthy percentage or real figure, met a goal in an impressive period of time, or achieved some other measure of success, let your audience know.
Explain The Market Share of Your Products
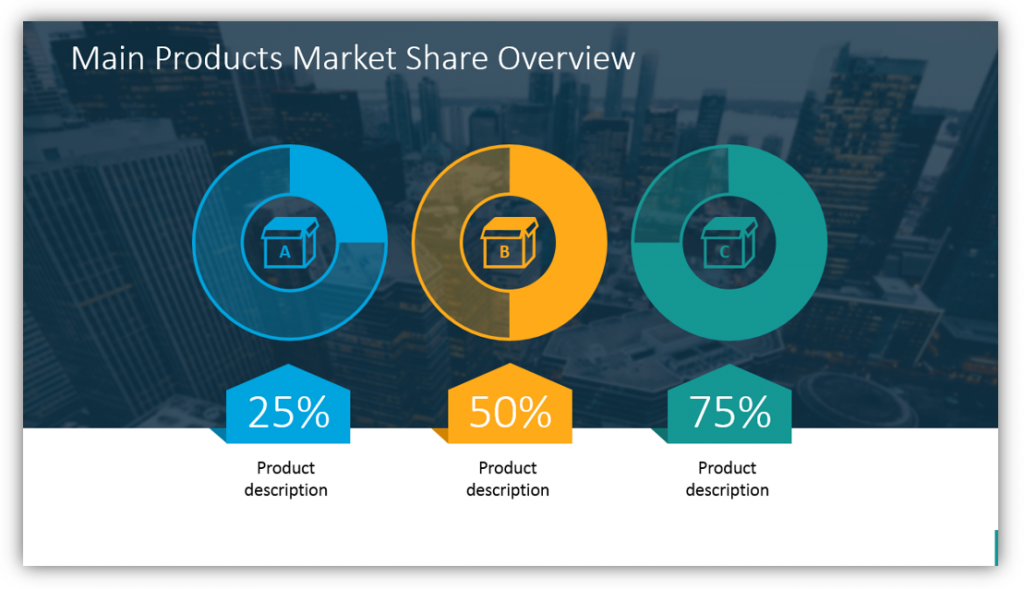
Which of your products perform the best? Which products perform best in their respective markets? You can share these figures and more with a slide committed to your market share overview. You can use different icons to represent various products, or rely on labels to distinguish between them.
Highlight Your Executive Team and Company History
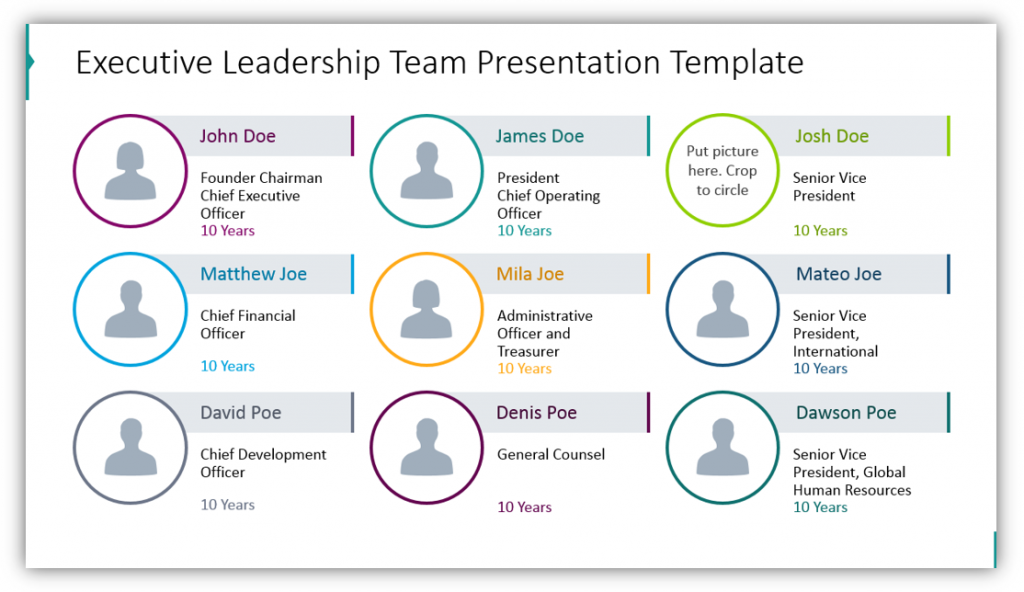
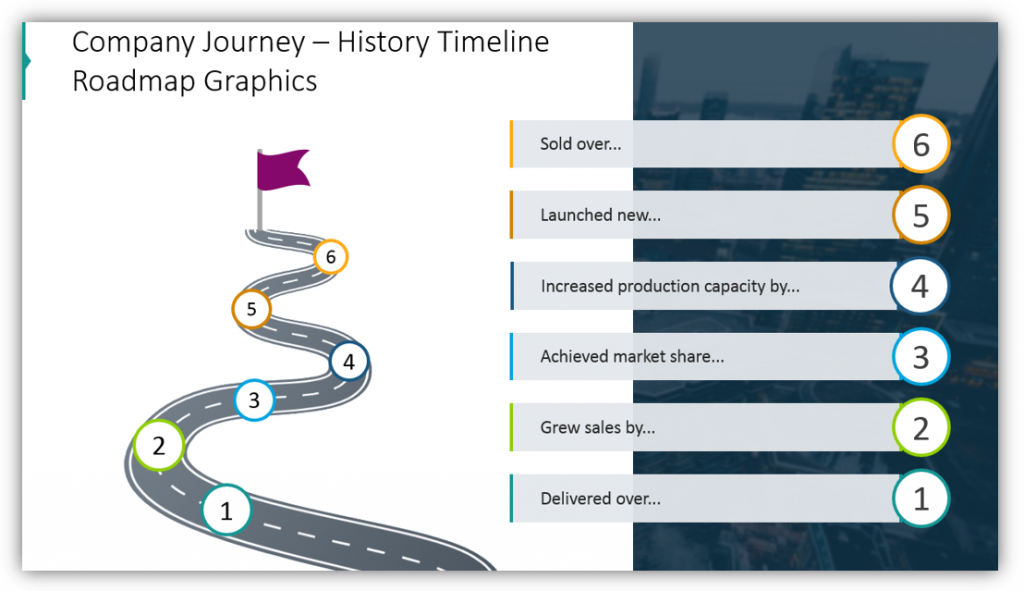
If the secret to your winning strategy is your executive leadership or team – let your audience know. This template allows you to describe your executive leadership team in detail in a uniform manner that will be easy for your audience to interpret. You can use icons to represent individuals or use their photographs – the choice is yours! You can also share your company’s history and timeline. Whether you use the road to represent the company’s timeline from creation to the present or just share a detailed breakdown of the events of the last year you can paint a clear picture for your audience. Let them know about the struggles which might have kept you from your goals, and let them know the steps you took to avoid the pitfalls.
Spell Out the Financials with an Annual Financial Summary Table
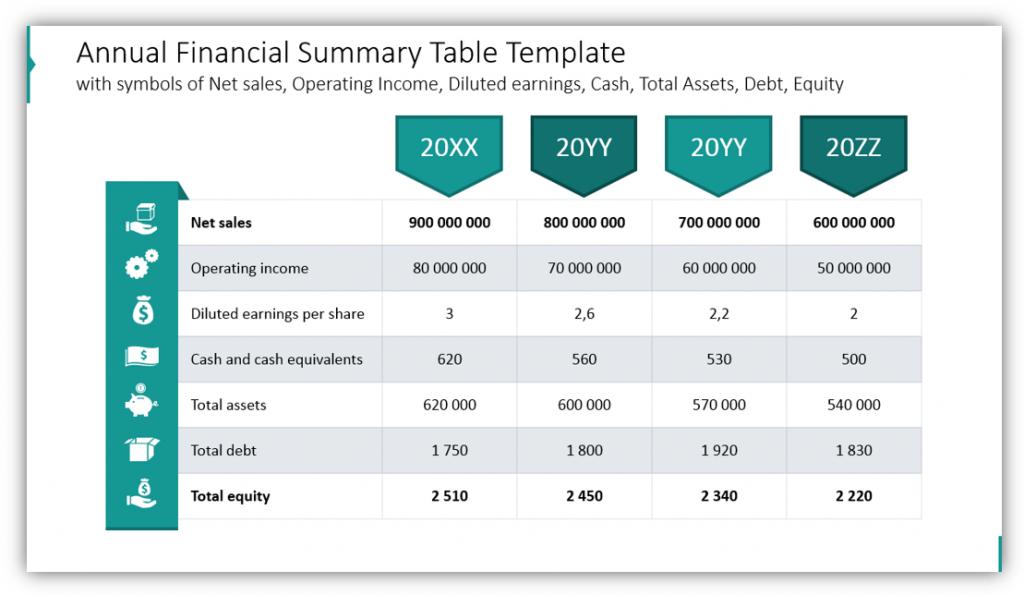
Use symbols to express and label your net sales, operating income, diluted earnings per share, cash and cash equivalents, total assets, total debt, and total equity. Alternately you could share other financial figures such as revenue, the cost of goods sold, gross profit, costs of operations, EBITDA, and the Net Income. It all depends on what your audience wants or needs to see. The great thing about these tables is they are completely customizable. You can show the progression across a period of time, as in the above example. However, you can also share the previous year’s goals and the next year’s projected goals for comparison – all on one slide.
In addition to these examples, you can use these icons to describe annual growth, the yearly earning per share, the net sales of top products and more with additional charts and graphics. If your company has expanded globally, nationwide, or regional each you can display these accomplishments with maps and other charts in addition to the financial accomplishments. The less exciting slides with legal information and details can also be spiced up with the use of icons and tables.
Resource: Stock Financial Annual Report
Providing visual components will help your audience connect with your material. By sharing details about your executive team and photos of them you’re allowing your audience to relate to them on a greater level. By sharing the company history and timeline you’re telling a complete story rather than presenting “dull financial information”. Nothing in business happens in a vacuum, there’s no need to ONLY present figures if you have relevant facts and supplementary background information.
If you want to look at the full stock performance set and brainstorm how you can use the full diagram pack, you can download the collection here:
Want to use the Stock Financial Annual Report graphics set, but feel like something’s missing? Check out Business&Marketing slide decks collection for more graphic variety and additional templates.


