How to Illustrate Triple Bottom Line Business Model Creatively in PowerPoint
Working on sustainability strategy? Looking for an effective way to communicate it? If you need to present the triple bottom line business model, check this blog for visualization examples and inspiration.
Transform your business presentations with our expert resources. Discover more on our business performance presentations webpage.
What is a Triple Bottom Line business model?
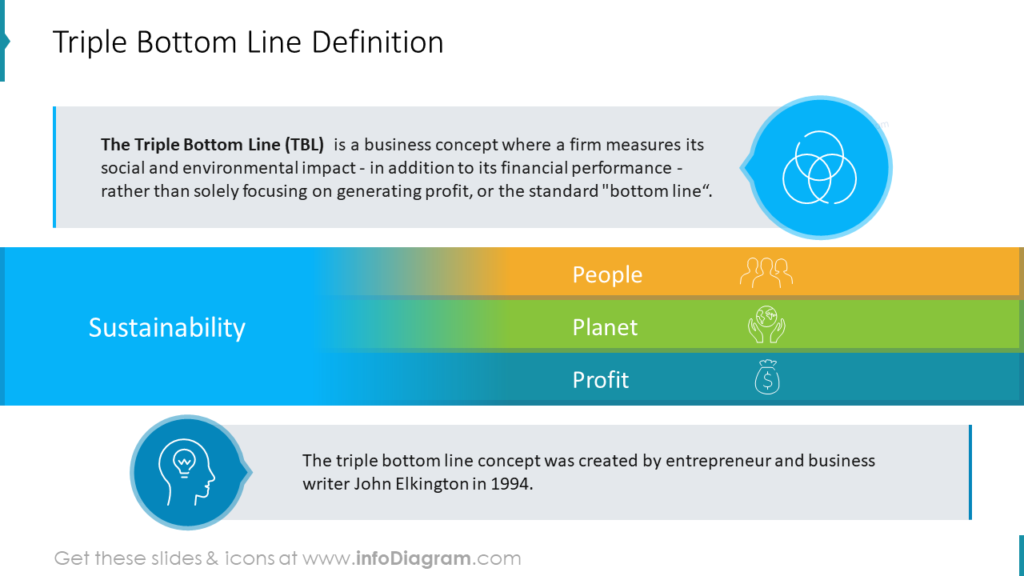
The triple bottom line (TBL) is a business concept where a firm measures its social and environmental impact – in addition to its financial performance – rather than solely focusing on generating profit, or the standard “bottom line“. Measuring business using TBL is one of the best evaluation methodologies to verify how sustainable and profitable the business really is.
Get inspired by slide examples of how you can illustrate the components of the sustainability strategy. We added also a quick guide on how you can design a triple bottom-line metrics table, however, you can apply these slide redesign tips to any table.
All graphics presented below can be downloaded as an editable slide. Explore the Triple Bottom Line & Sustainable Business Strategy PowerPoint Deck.
Visualize the essence triple bottom line idea
To structure your presentation deck and make sure it will be easy to follow, you can apply color coding to three performance categories. In our slide example, we chose yellow for the people category – social sustainability for performance, green for the planet – environmental category, and blue for profit, that is for economic performance.
You can present the interconnection of these three areas using a structure diagram like this, using the Euler diagram:
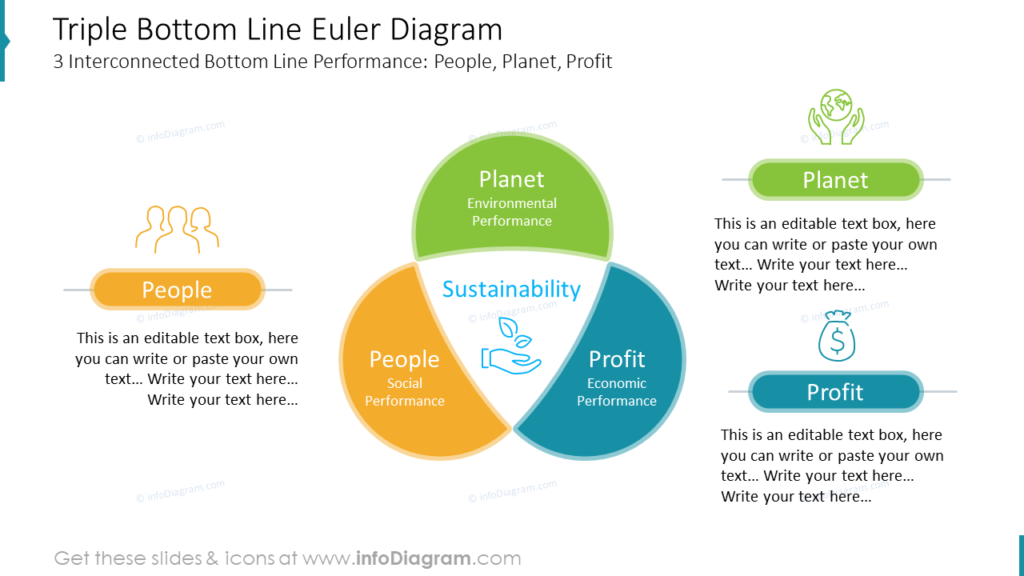
Such a diagram will help you illustrate the TBL idea and its three interconnected elements.
Social Sustainability Targets Illustration
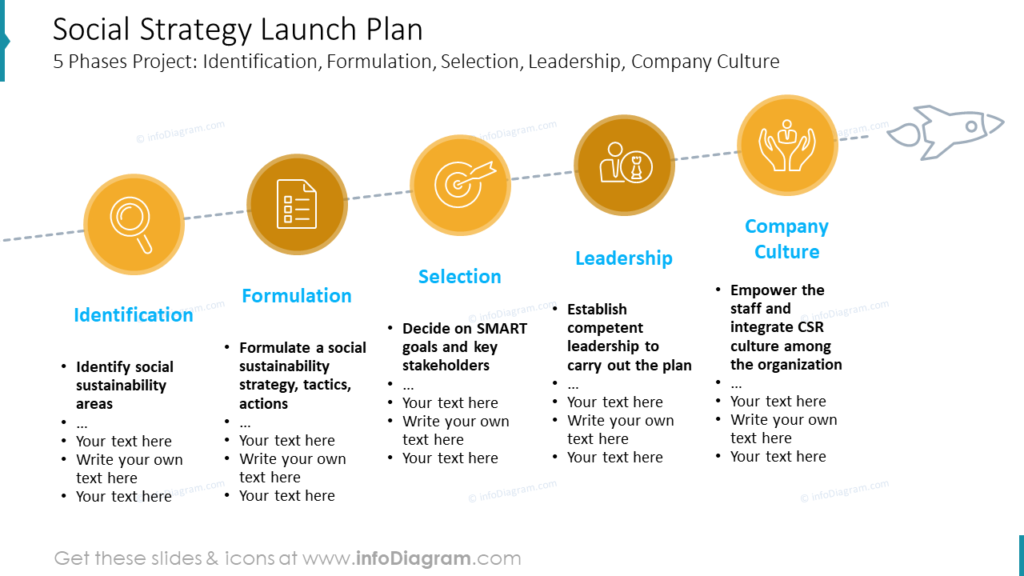
This slide shows how you can showcase the social strategy launch plan project phases: Identification, Formulation, Selection, Leadership, and Company Culture. They all are connected with a dotted line and the icon of a rocket at the end to express the launch flow.
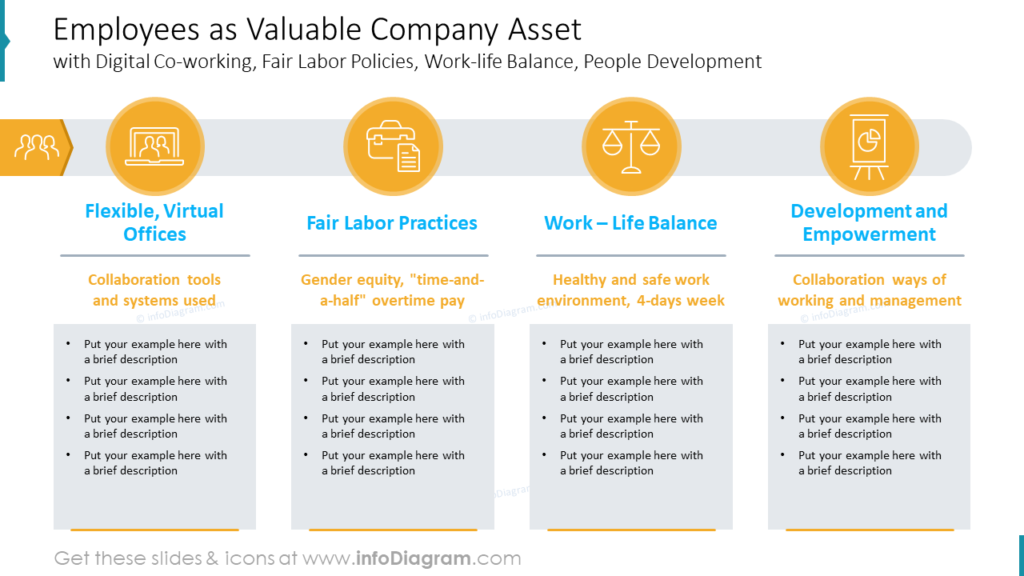
Great people make great companies. If you want to emphasize the fact employees are a valuable company asset, you can reuse such a table. Notice how icons are used to bring visual association with each element: Digital Co-working, Fair Labor Policies, Work-life Balance, and People Development.
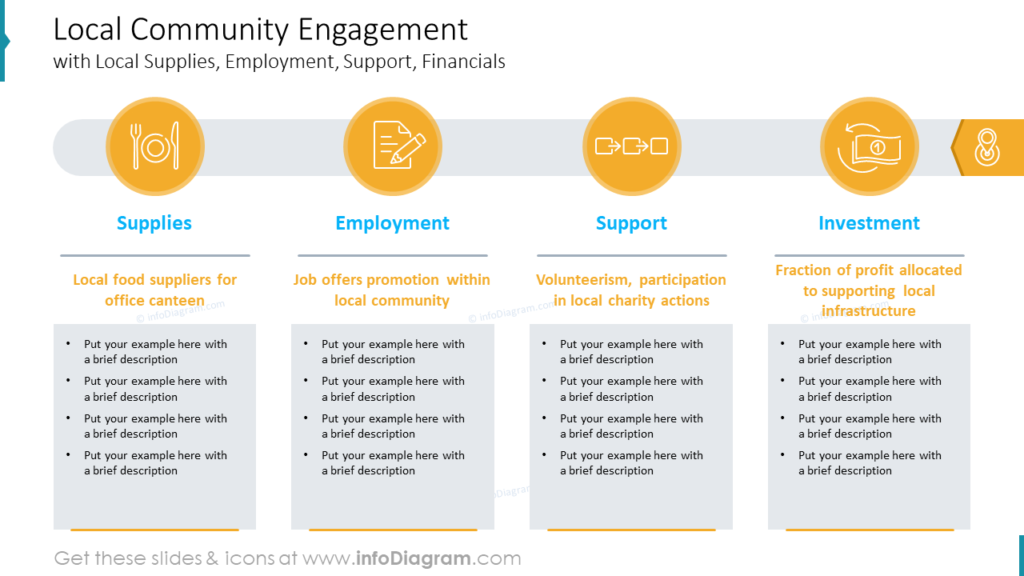
Want to share a plan on how you will engage the local community? This diagram includes the common components, such as Local Supplies, Employment, Support, and Financials.
Present Environmental Sustainability Targets Visually
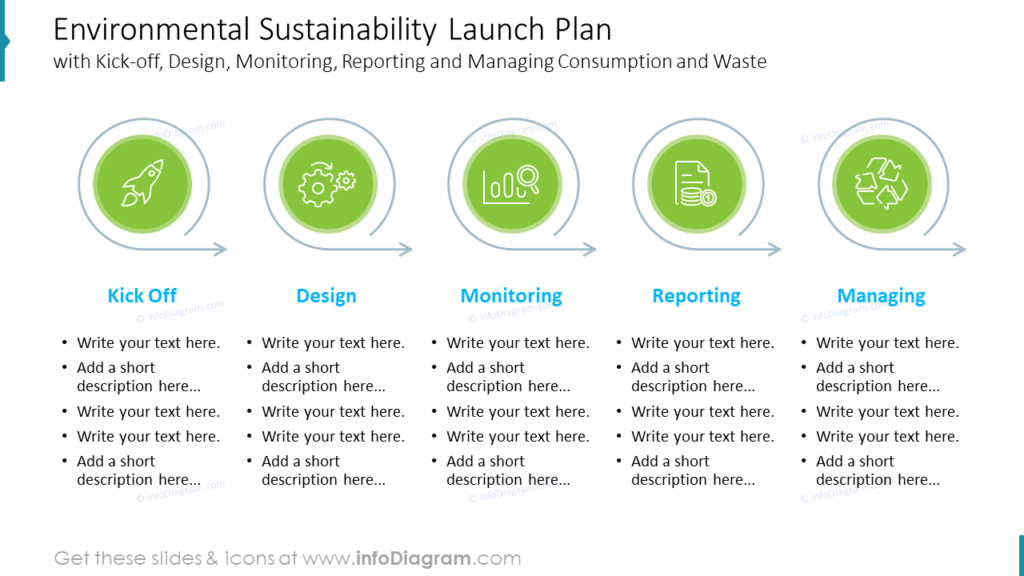
To present an environmental sustainability launch plan, you can use 5 steps introduction process diagram. We included the following typical phases and showed them with symbols: Kick-off, Design, Monitoring, Reporting, and Managing Consumption and Waste.
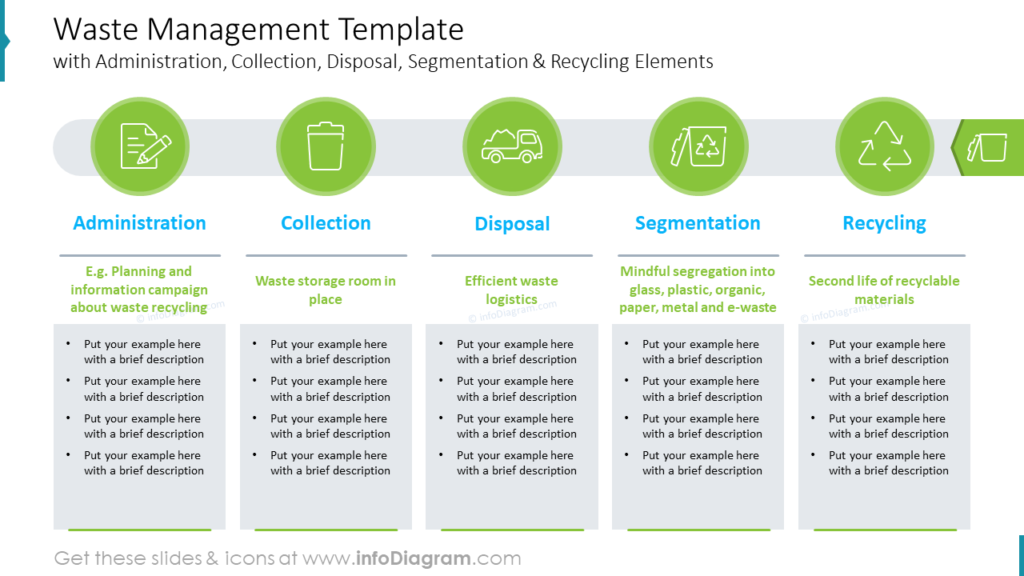
Such a diagram will help you explain the general strategy of waste management. On the example slide, you can see the five elements: Administration, Collection, Disposal, Segmentation & Recycling.
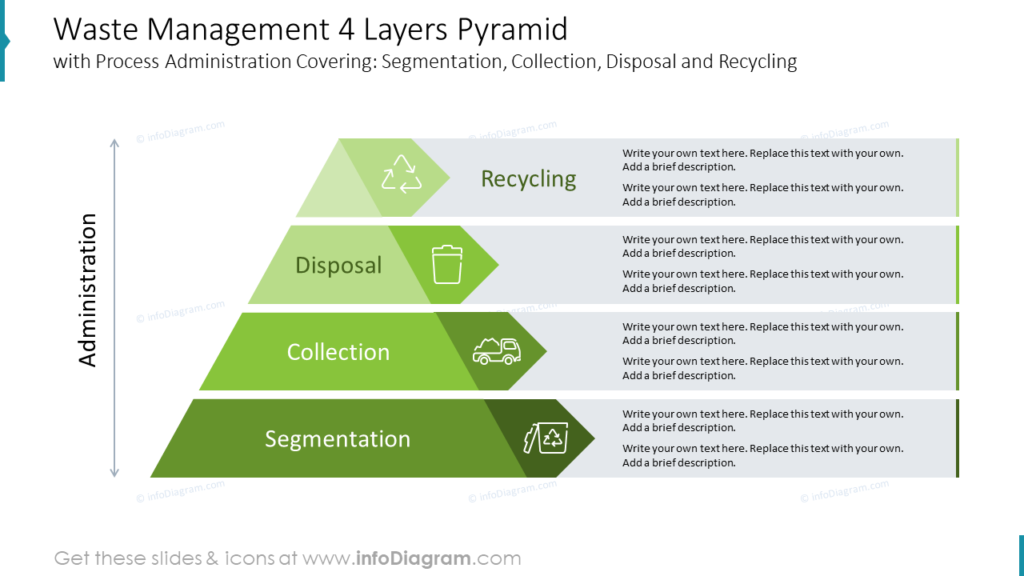
You can also use the 4-layers pyramid to show the structure of waste management process administration.
Address Economical Sustainability Targets
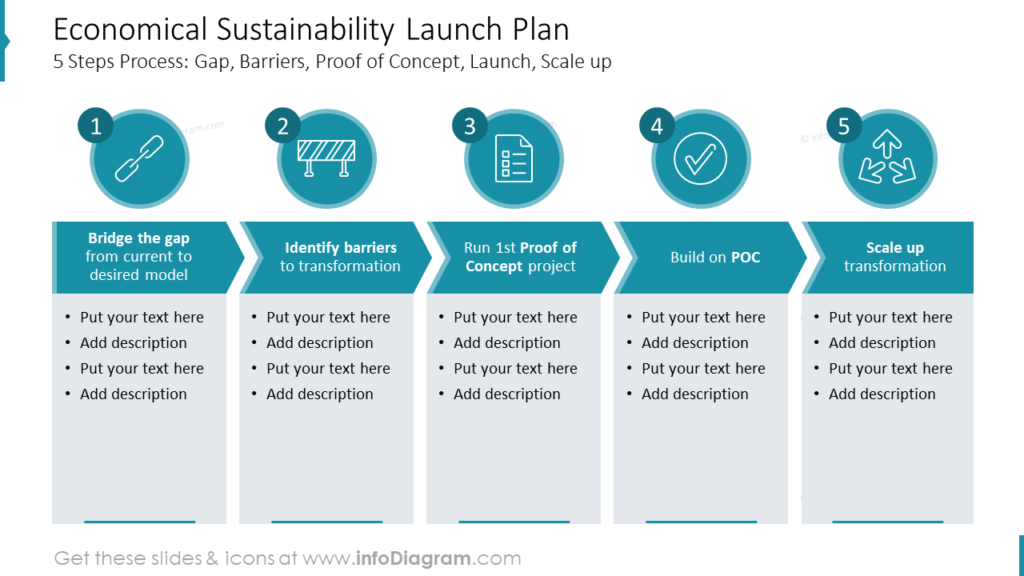
You can start by introducing a 5-step process launch plan. Typical steps of such a plan can include:
- Bridge the gap from the current to desired model
- Identify barriers to transformation
- Run first proof of concdept project
- Build on POC
- Scale up transformation
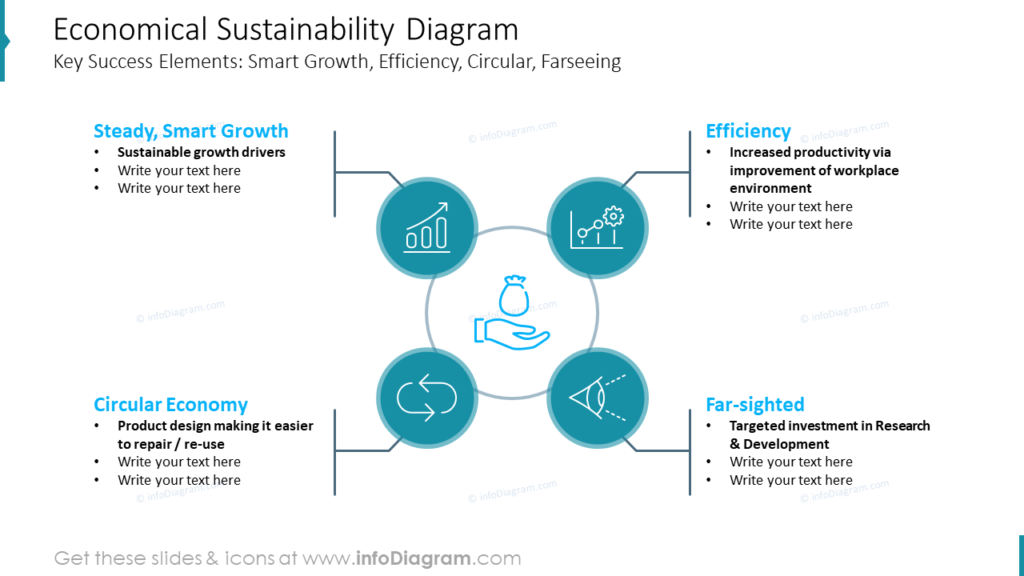
Then illustrate key success criteria for reaching economical sustainability in 4 elements diagram, for example:
- Steady Smart Growth – sustainable growth drivers
- Efficiency – increased productivity via improvement of workplace environment
- Circular Economy – product design making it easier to repair / re-use
- Far-sighted – targeted investment in Research & Development
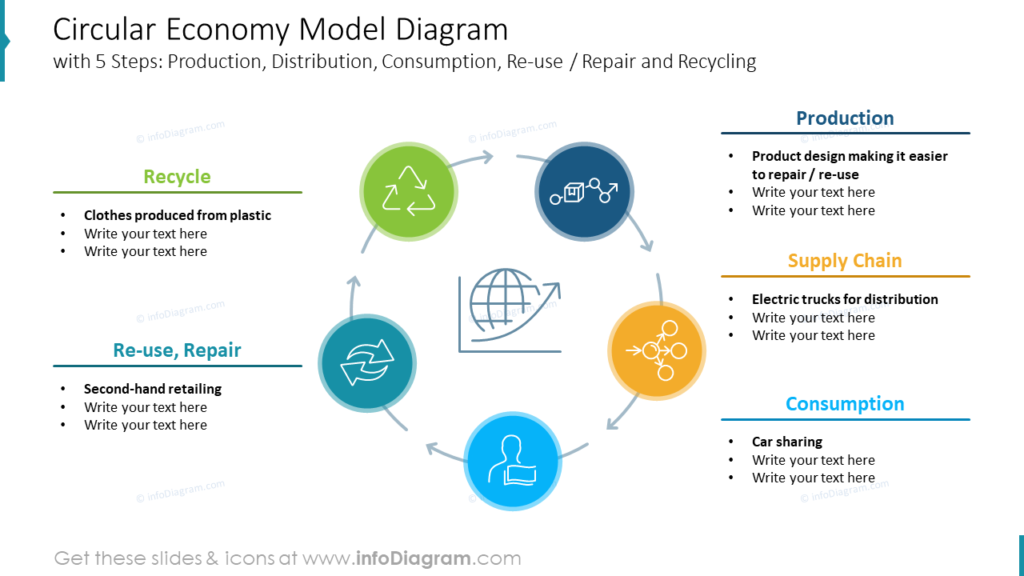
You can also expand presenting the circular economy model:
- Production – e.g. product design making it easier to repair or reuse
- Supply Chain – e.g. electric trucks for distribution
- Consumption – car sharing, for example
- Re-use / Repair – second-hand retailing, or other ways to support re-use
- Recycling – of clothes produced from plastic materials, for example.
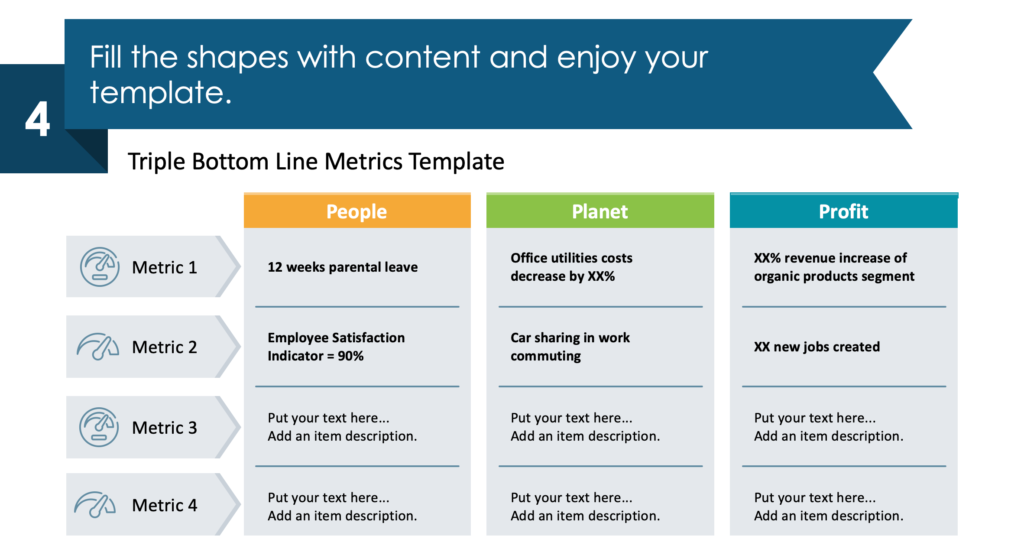
Close up with Triple Bottom Line Metrics
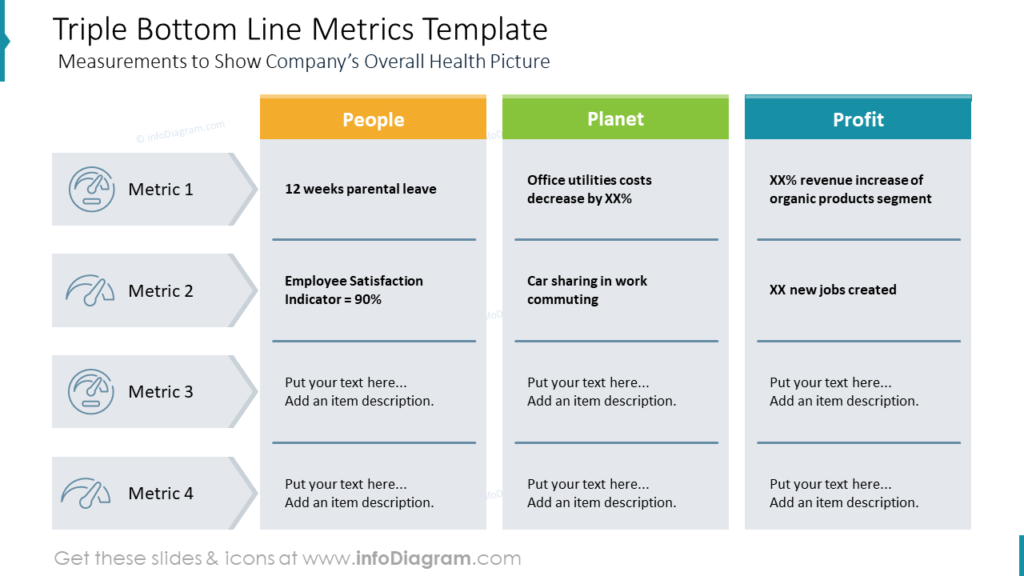
After you discussed each element, strategy, and tactic, you can close up with the measurement plan to show the company’s overall health picture.
To present such a set of triple bottom-line metrics, consider showing it all together in one table. See how you can make such a table look more appealing using simple design elements, such as arrows and lines. Read on to learn how you can create a similar slide from scratch.
Guide on how to visualize Triple Bottom Line Metrics Table
Usually, any metrics are presented as a simple bullet-point list or default table overloaded with information. Check a short instruction on how you can create an attractive metrics slide to show triple bottom line metrics using simple shapes, colors, and a few tricks that will save you time.
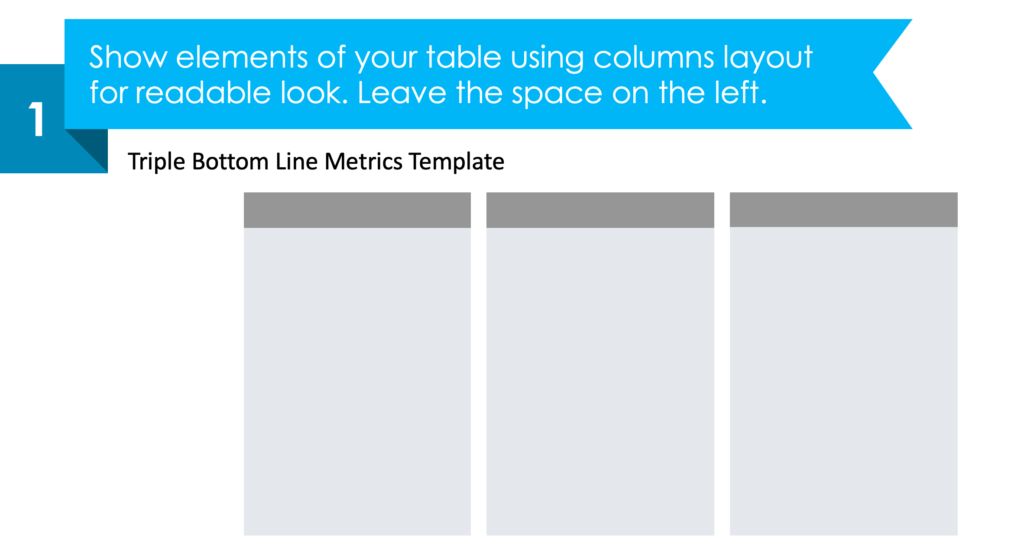
1. Show elements of your table using a column layout for a readable look.
Firstly create a table columns structure using standard rectangle shapes.
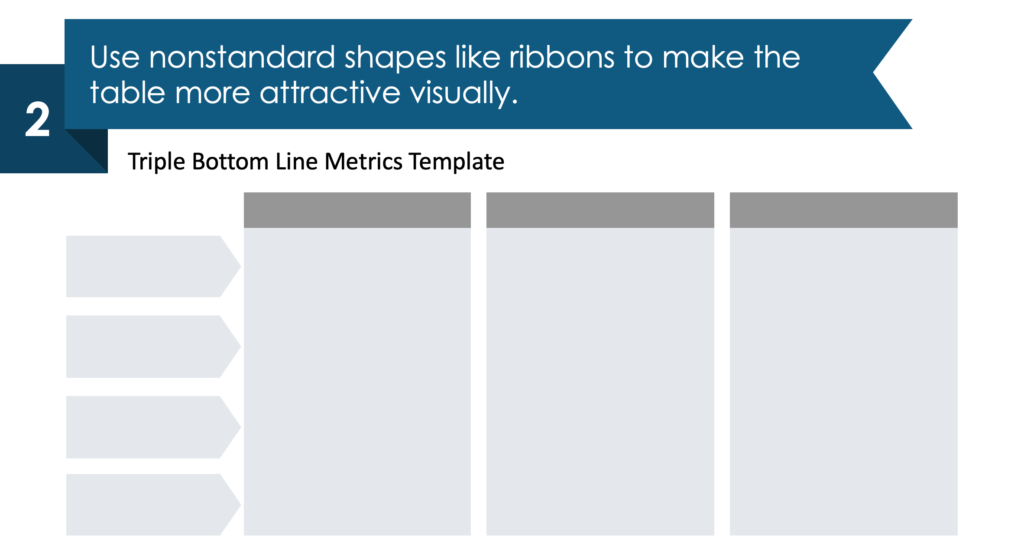
2. Use arrow shapes to make the table’s 1st column more visual.
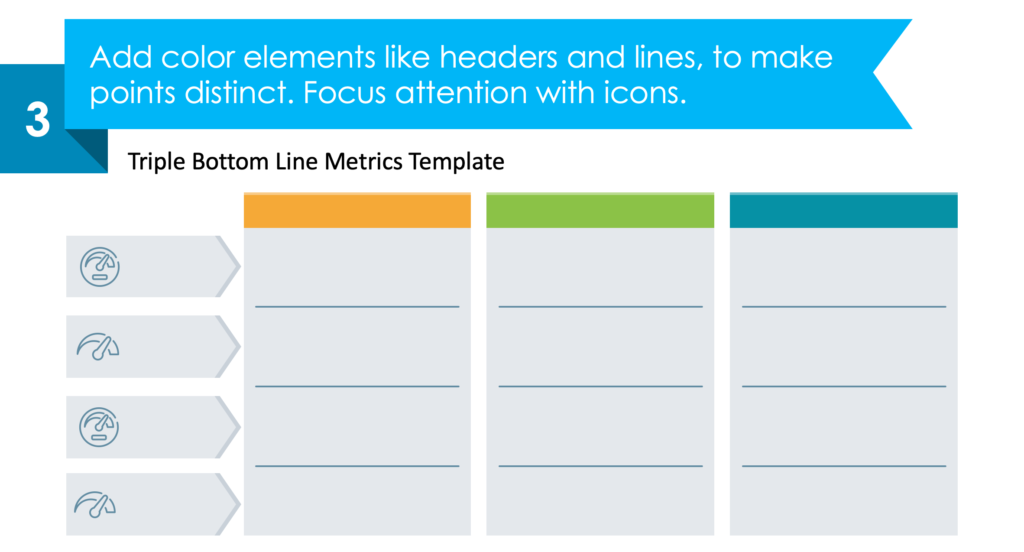
3. Add color elements like headers, lines, and icons to make points distinct.
4. Fill the shapes with content and enjoy your template.
Explore our YouTube channel for more creative inspiration:
Resource: Triple Bottom Line Sustainable Business Strategy Deck
If you’re looking for an icon to illustrate climate-change topics or sustainability principles, types, or core pillars, check our sustainability symbol ideas to show these concepts effectively.
The slide graphics in this blog are a part of our triple-bottom-line strategy deck. It contains templates to illustrate the TBL strategy and its three areas: social sustainability (people), environmental sustainability (planet), and economic sustainability (profit). See the full presentation here:
Using modern and clear infographics will make your presentations structured and consistent. If you need a wider set of diagram structures, check this collection of universal diagram layouts.