How to Present Circular Economy Models and Principles in PowerPoint
Are you about to present sustainability or a circular economy topic? If you are talking about the linear model versus the circular model, the 7 R’s model, circular economy principles, or benefits, we have some inspiration for you.
Take a look at how to add visual impact to your slides and how you can attractively present Circular Economy concepts.
Source of graphics presented here is available for download (link to visuals: Circular Economy Models & Principles here).
Click on the slide pictures to see and get the editable illustration.
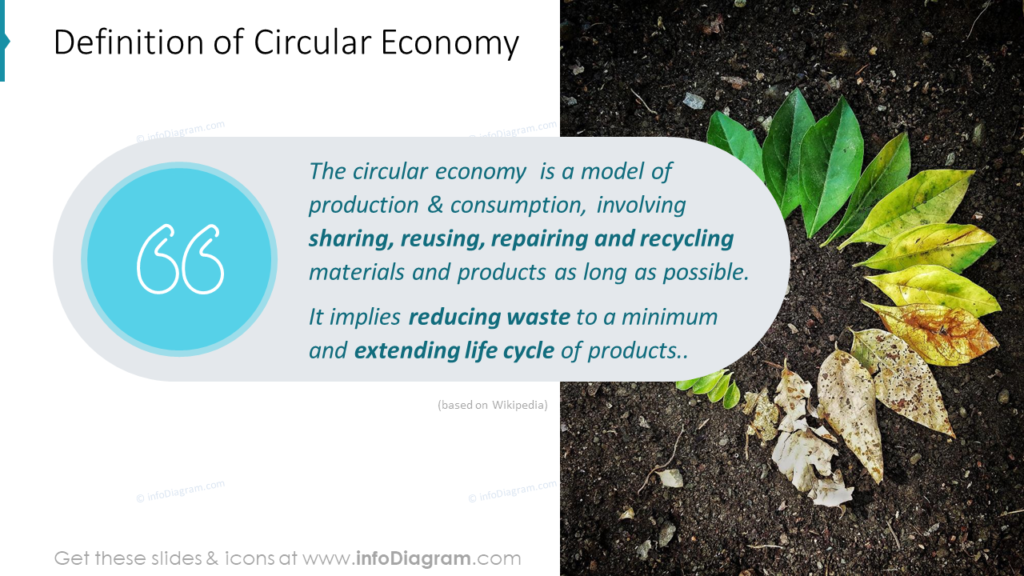
What is a Circular Economy? Presenting a definition with an attractive slide
The circular economy is a model of production & consumption, involving sharing, reusing, repairing, and recycling materials and products for as long as possible. It implies reducing waste to a minimum and extending the life cycle of products (according to Wikipedia).
It’s a good idea to present a definition at the start of your presentation. To make the definition slide attractive to look at, apply a nice visual layout. For example, we added the picture of soil and leaves to illustrate the topic of the sustainable economic model. You can also place the quoted text itself on some graphical background – we used a light grey text placeholder shape and added an icon of quotation marks, embedded in a circle. These circle shapes are part of the whole presentation style, so we will use them on the next slides as well, to create strong visual consistency.
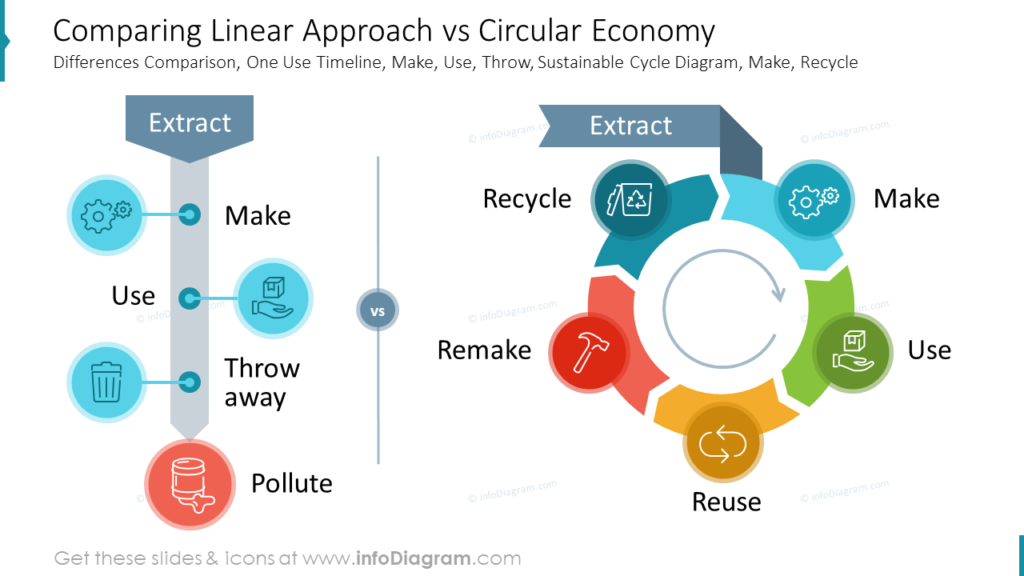
Comparing Linear Approach vs Circular Economy by diagrams
To show the concept of Circular Economy it’s good to confront it with a linear approach to stress the difference and impact on the environment. First, you can show in one line the steps of the linear economy (including throwing away and polluting). Then you can use the nice circular diagram to show all the elements of the circular economy:
- Extract
- Make
- Use
- Reuse
- Remake
- Recycle
Adding a visualization such as icons is always a good idea to help build associations. Take a look at icons ideas and the whole concept.
Selecting icons for particular elements is easy in some cases e.g. trash can for throwing away the waste, or hammer or gears representing the making, the production stage.
To keep the slide readable, we recommend using a simple flat diagram style.
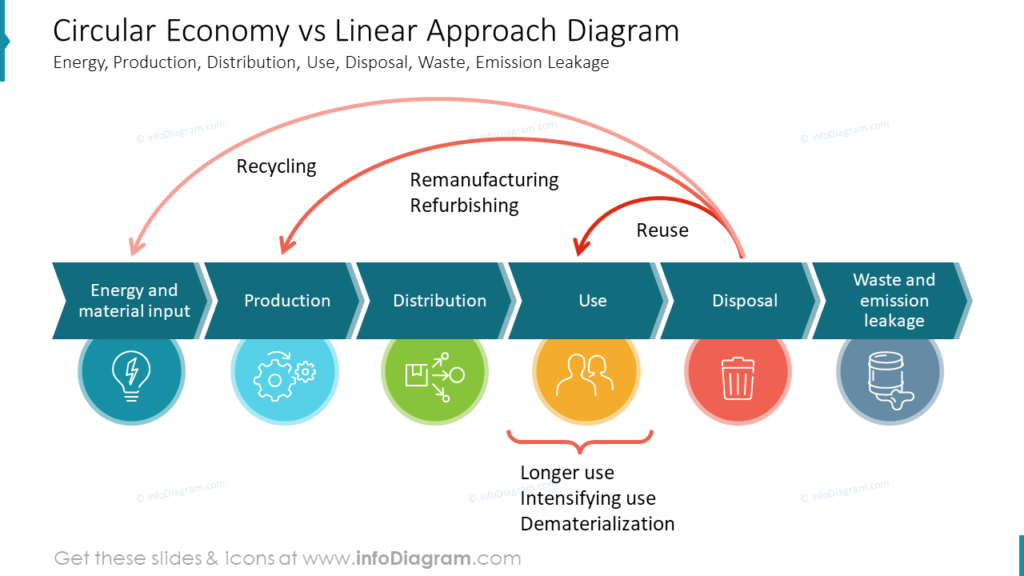
We could show this comparison also on one diagram. Here you can see how at the point of disposal we can reverse the process and give second lives to products or remake it or just recycle them. You can use a chevron shape for each step and add icons in the circles below. Finally, you can use arrows to show the concept of circularity and sustainability.
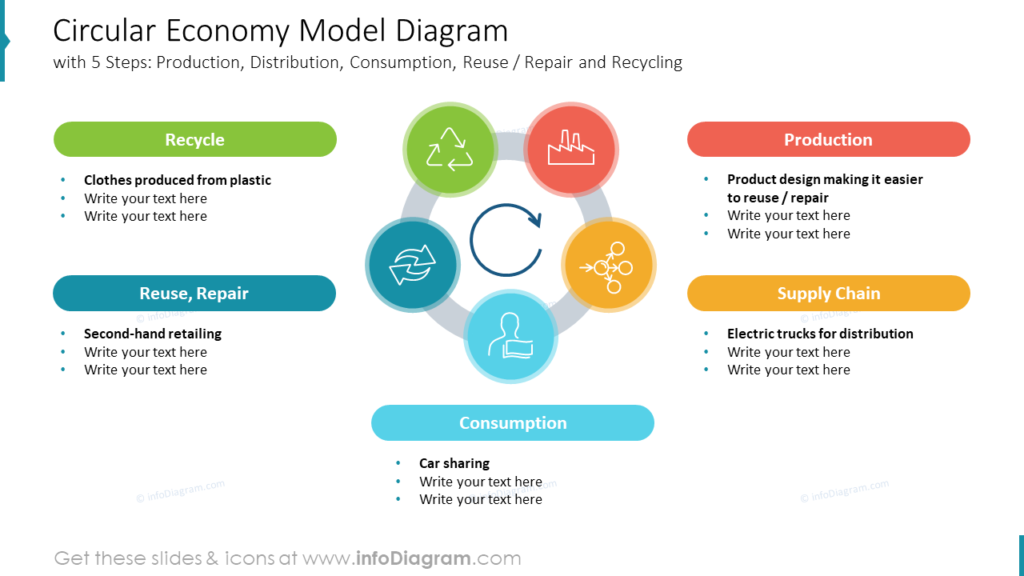
Showing a Combination of Circular Economy flow by one Chevron diagram
When you want to show circularity e.g. by a closed loop of 5 steps it’s good to start with a gray ring and evenly place circles with icons around. You can insert a round arrow inside to suggest a cycle.
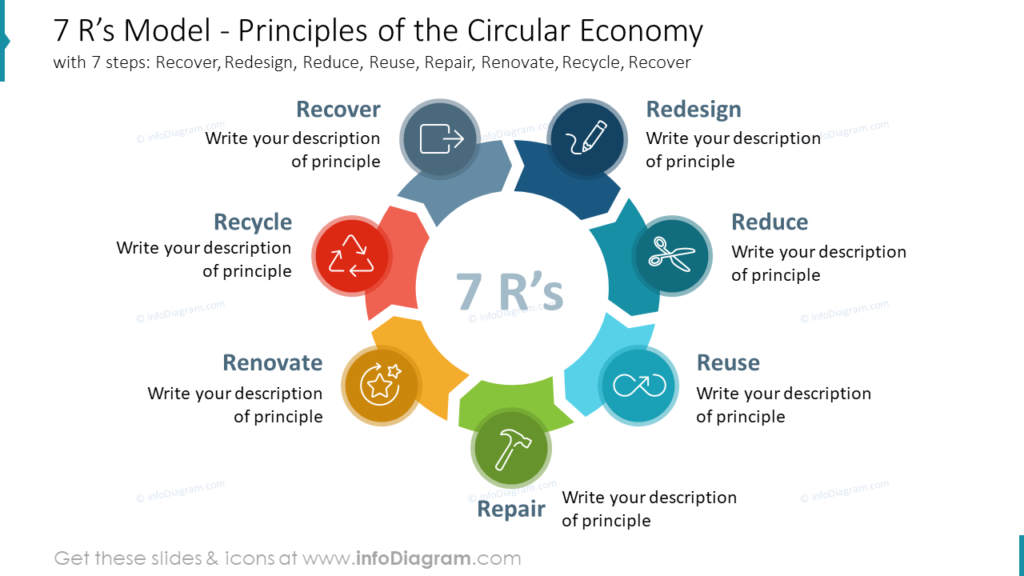
Present the 7 R’s model with principles of the Circular Economy
Explain the 7 R’s principle by placing a circle consisting of chevrons and adding icons to create visual metaphors. Place texts for each step and add a symbol illustrating it:
- Redesign represented by a pen icon
- Reduce with a scissors icon
- Reuse is shown as an infinity loop
- Repair with a hammer
- Renovate visualized by stars that symbolize new in a circular arrow
- Recycle by well-known sign
- Recover is represented by an icon of a box with an arrow going out.
You can present all this information on one concise slide, like this:
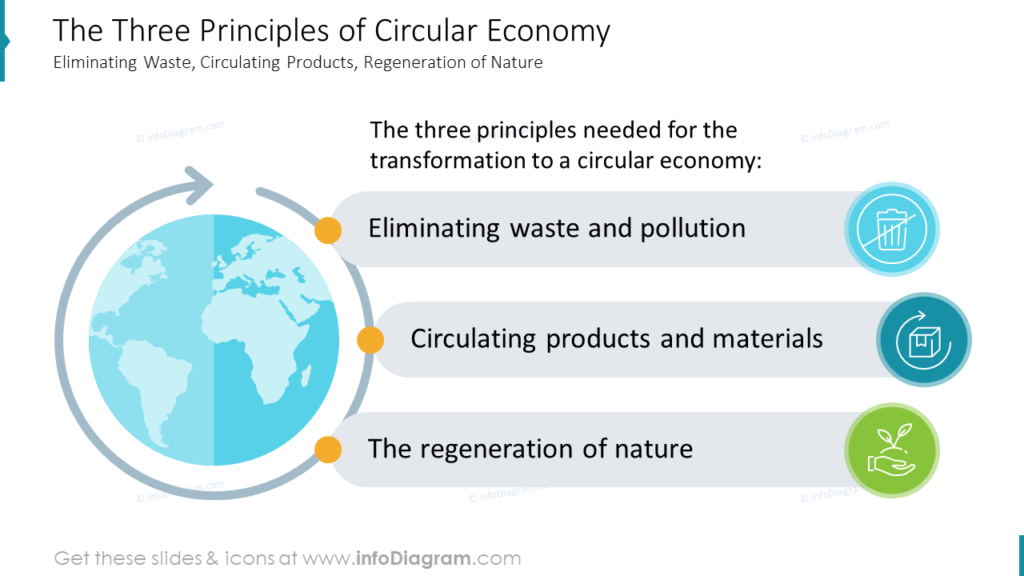
Visualize 3 principles of the Circular Economy
Continuing with the principles of CE you might want to show 3 main points. You can anchor your points on illustration with a world and arrow. Illustrate every idea with an icon in a circle. In our case, those principles are:
- Eliminating waste and pollution
- Circulating products and materials
- The regeneration of nature.
We designed that slide as simple infographics, embedding graphics of the Earth with a looping arrow around it, to underline the global influence and circularity concept.
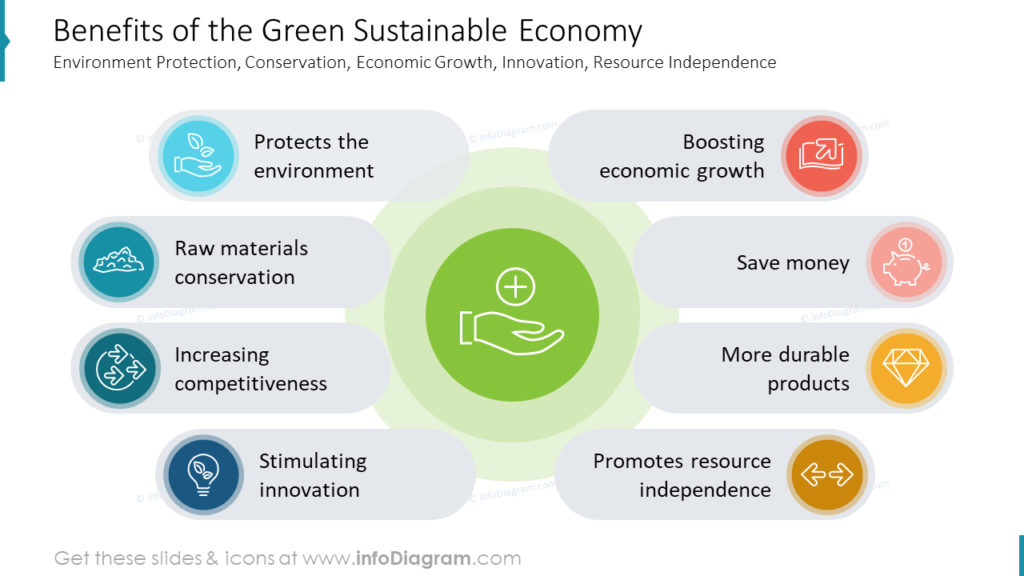
Presenting Benefits of Circular Economy slides
When presenting the benefits of using Circular Economy you can place in the middle benefit icon in a circle to draw attention. Radially distributed points will add a nice visual touch to the layout. Finish your list with icons that match the slogans.
With basic design rules such as consistent style of icons and colors, not overloading the slide with content, and the use of graphical symbols, you can make a stunning presentation and overall impression.
Resource: Circular Economy Diagrams PowerPoint Template
The examples above used the graphics from a PowerPoint template on the topic of Circular Economy Models & Principles. All slides are available in the infoDiagram collection of presentation graphics:
See more examples of presenting sustainability related ideas:
- ESG Metrics presentation examples
- Explaining Climate Change Actions Visually
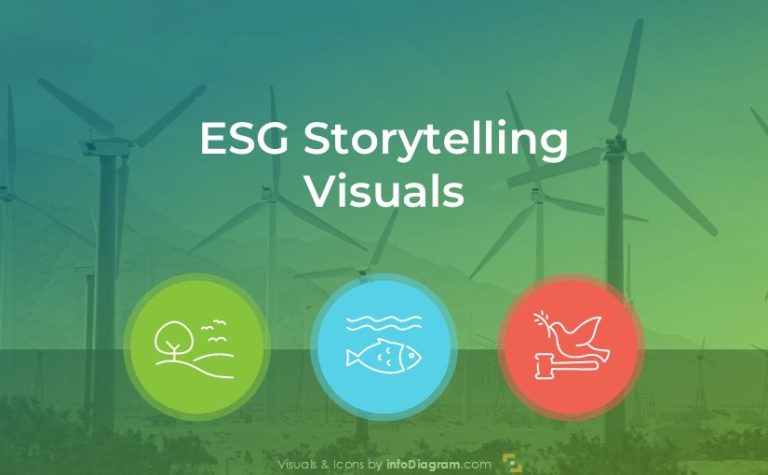
- Visual storytelling presenting ESG essentials
Or watch video tutorial on redesigning Circular economy slide