Data Scientist Presentation Toolbox – 5 Handy PPT Templates to Use
A data scientist job requires not only specific technical IT skills but also soft skills, in particular presenting the work results to your peers or executives.
Therefore it is a handy shortcut to have a set of PowerPoint templates you can use to quickly create professional slides on the topic of data analysis or predictive modeling.
Let me present the selection of presentation blueprints I would recommend to senior or junior data scientists, analysts, or IT consultants to make their work easier.
Get any of the graphics presented here – click on the slide pictures to see and download the source illustration. Check the full collection of Data science PowerPoint templates here.
I used to work in an analytics consulting company for several years. My work included presenting data mining models and making tens of marketing materials explaining big data analytics solutions my company offered at that time.
The main challenge was to translate sophisticated predictive technology for business people not aware of all the technical details of various machine learning algorithms or data processing peculiarities. Using graphical diagrams and illustrations helped me a lot and I believe it can be useful also for you.
What do data scientists actually do?
The work of a data scientist requires a background in several fields, as this job involves:
- understanding the IT infrastructure: how data is stored, what is the database system, what’s the OLAP cube structure (see OLAP cube slide examples in this article), how data is updated, etc.
- the informatics theory: information processing, data structure types, effective data handling e.g. using SQL of visual tools
- applying advanced statistical techniques and mathematics to calculate predictions, correlations, and associations among data trends
- interpreting results – need good communication skills to present your work well
Tasks performed by data scientists start with collecting the data, preprocessing it, and exploring properties and main statistics. And just then data is used to create a predictive model. Such a model needs to be tested before being put into production, for example, to estimate a credit risk score.
All those tasks can benefit from using visuals to present them.
How to make a good presentation of Data Science concepts?
A presentation on a topic related to data science usually belongs to more complex ones. It is full of technical terms, data charts, and non-trivial statistical analysis correlation explanations. Therefore it’s important to keep in mind the following hints.
Have a clear presentation structure
Having a clear structure even before you start making slides is crucial. Write down what you want to present. I would recommend even doing it on paper first, as this supports creativity – more in this blog.
If your presentation is a long one, it’s a good idea to show this structure on the agenda slide so your audience will get a vision of what the presentation will be about.
Define the audience of your data analytics talk
Before going deeper into designing a presentation, ask yourself a question: who is your audience?
- Are they laics (students, new hires, journalists for example) who need an explanation of all technical terms used in data science?
- Or is it a group of AI experts who are interested in details?
- Or do you present to the executive board who wants to know the project cost and financial impact?
Write down the main message you want to communicate
After settling down the audience and structure, think about what’s the main message you want to convey. Is it a certain dependency? List of most important attributes? Performance of a scoring model? A quality measure of a forecasting system? Or a financial impact, or ROI of the machine learning system as a whole?
These are questions your audience can ask you as a data analyst, depending on who you are presenting to. Make sure this message is properly stated on a slide, in the beginning, at the end summary, or both. And then make sure all slides support this message, by presenting facts and supporting evidence by model quality statistics or operational model performance KPI values.
In the end, don’t forget to add a summary of data science project outcomes. Having a simple executive summary slide with main deliverables and effects can do the work.
Suggested PowerPoint templates for data scientist tasks
Here is a suggestion of several templates you can reuse for your analytical report or speech. You can use them as a whole presentation or just copy specific segments or graphics to your slides.
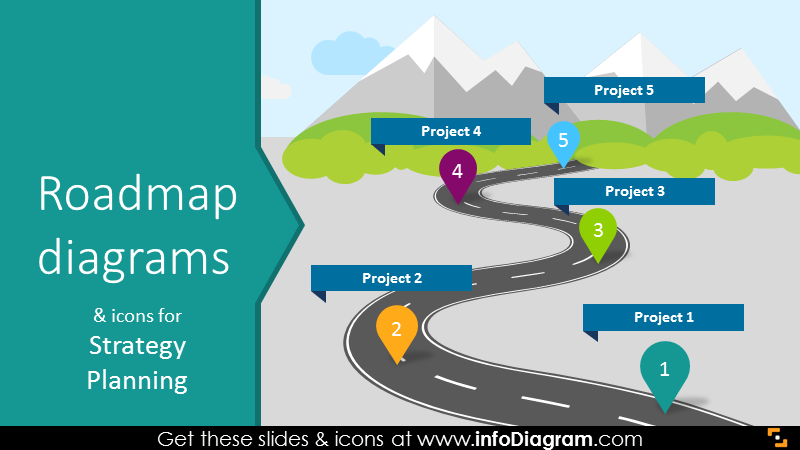
Project Timeline and Gantt charts templates
In case you are presenting a project involving data analytics and modeling, you can use a template with calendar timeline diagrams graphics, to show how long the data science project takes.
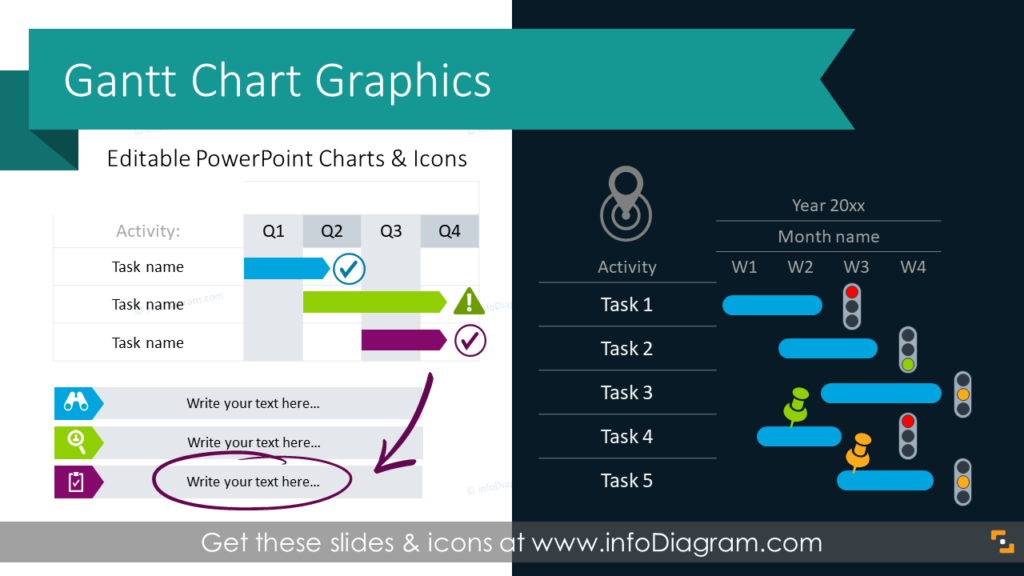
Using graphical flowcharts, you can clearly present your analytical project assumptions, and preparatory steps, which included the implementation phase and final project delivery.
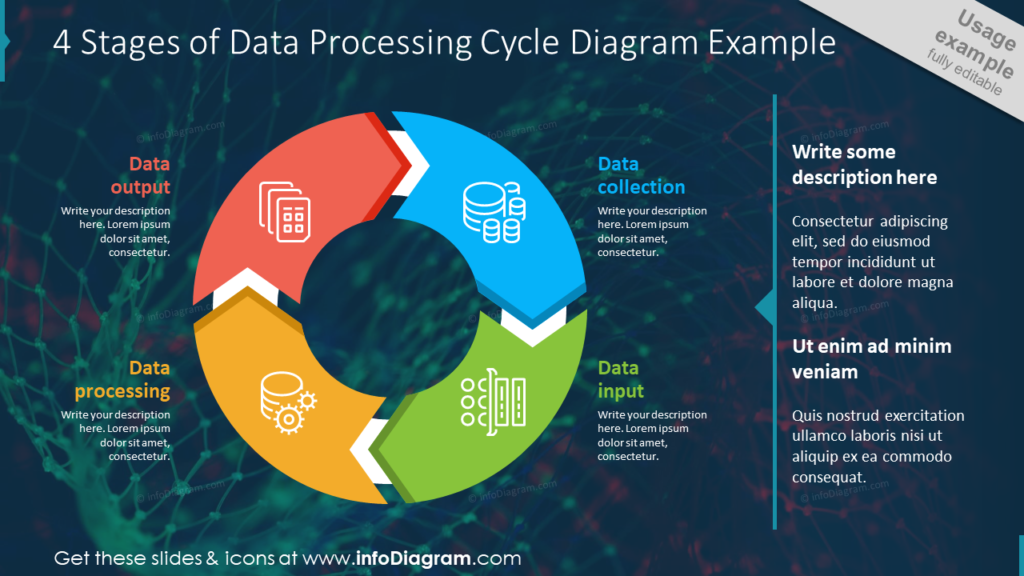
Data description presentation icons
For the initial analysis of available data, their structures, and types, there is a template with various data categories and analytical processes. For example, you can present the whole data mining process of designing a predictive model as a flowchart diagram with steps for each stage.
If you prefer another graphical style – here is a more elegant outline icon set:
Big Data concept presentation template
If you need to present the concept of Big Data, check diagrams explaining the definition of 4Vs or 3V characteristics of big data ideas, along with a few recognized definition slides.
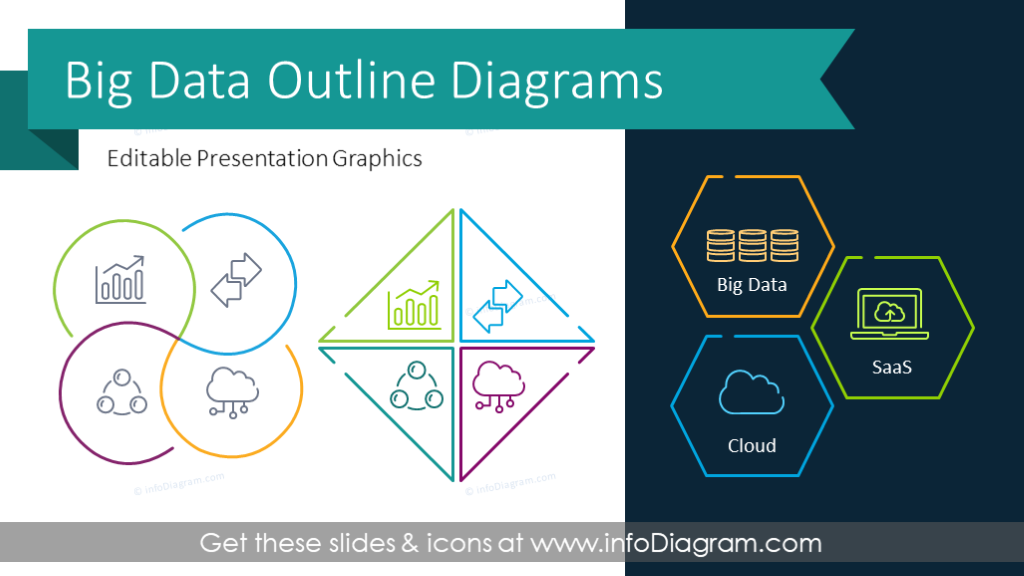
See more examples of slides explaining Big Data and learn how to make Big Data presentations visually appealing.
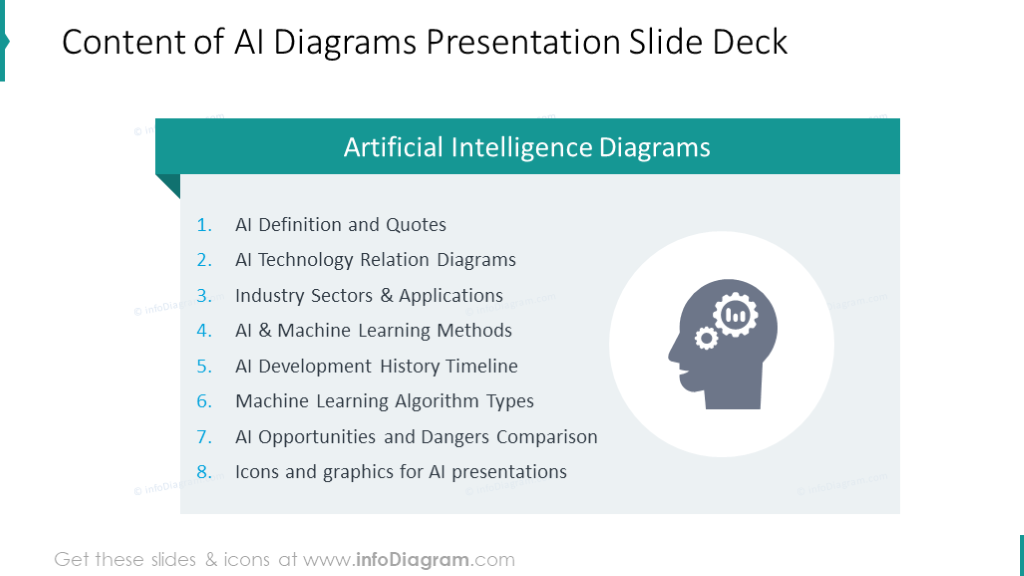
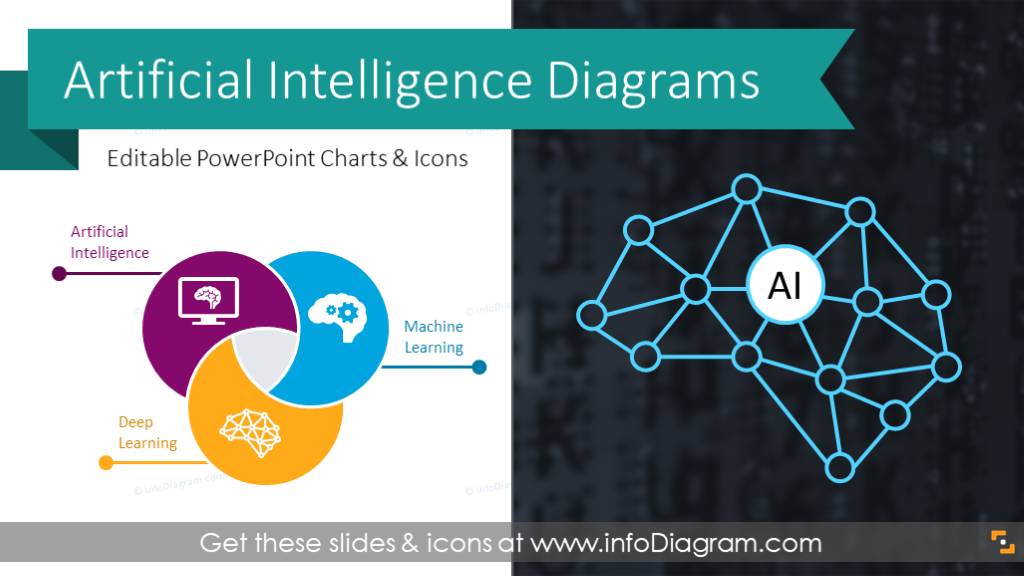
Artificial Intelligence and Machine Learning 101 presentation
For explaining what’s the essence of Artificial Intelligence and Machine Learning, we have also a presentation template covering this topic, including the history of AI and its application areas list. Having an editable PowerPoint source you can expand or modify all those diagrams and lists, to fit your industry and experience.
You may have many other topics to present – as data science is today present in various business areas. Ideas for other areas you can explore are here
- e-commerce dashboards
- blockchain essence presentation
- digital transformation processes
Feel free to explore those and reuse visualization ideas if they fit your work.
The main takeaways for a data scientist in making a presentation
The job of a data scientist requires a variety of skills. Besides obvious hard skills, you also need to handle some level of soft communication skills. Making an engaging and clear presentation of your work is one of those essential skills.
However, with the right approach and some experience you can handle this skill as well. Several presentation design tips to remember are:
- having a clear presentation structure
- defining the audience and adjusting content to it
- expressing the main message properly e.g. with the help of diagram visuals.
I shared several PowerPoint slide examples and templates you can use to get you started.
For more inspiration, subscribe to our YouTube channel:
Resources: Data work-related PowerPoint Templates
If you are interested in checking data-related slides, see those pages:
- data science presentations templates
- IT & analytics presentations
- Universal diagrams and flowcharts
Using PowerPoint template format – with various data-related graphics ensures you can edit all content, and texts, expand diagrams, or replace icons as you need. A PPT format template is an easy self-service toolbox that can improve significantly your work. You can also import those slides to Google Slides or Keynote presentation software if that is a presentation tool you use.