7 Presentation Templates for Comprehensive IT and Data Analytics
If you’re working in the IT, data science, or data analytics field or have a presentation to prepare, get inspired by our visual examples of how you can enhance the slides.
Explaining abstract IT concepts such as information sources, processes, or data structures requires ensuring that your audience will quickly understand what you want to present. The best way to address it is to use a visual form that is easy to grasp.
Therefore try to express complex IT ideas with diagrams and simple infographics. You can illustrate specific concepts with graphical symbols or show data flows using distinctive colors. The key thing is to keep visual clarity, to avoid a reader being lost.
Importance of visual communication when presenting data processes and structures
PowerPoint can be the right tool for presenting complex IT frameworks thanks to its flexibility if used right. Check out the following PPT templates with data-related graphics we’ve put together to help visualize various IT concepts. All these templates contain editable visuals to help you successfully communicate your ideas to the target group; whether this is your project team, pitching a software company, or teaching university students.
Keep reading to get inspired by the data analytics and IT templates for making illustrative presentations effortlessly.
All the slides presented in this post, and many more, can be found by clicking on the pictures. Check out the whole data analytics and IT diagrams PPT collection here.
Depending on your presentation topic, you could use these seven PowerPoint templates:
- Digital transformation strategy roadmaps
- Web analytics report charts
- OLAP data cube
- Artificial intelligence & machine learning
- DevOps know-how toolbox
- Blockchain technology
- Data science icons
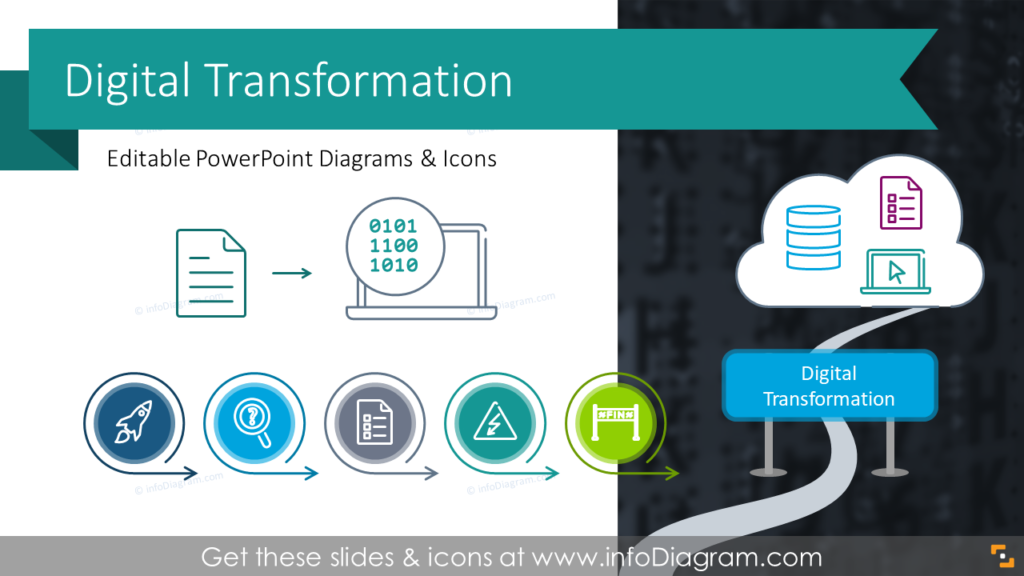
Digital Transformation Strategy Roadmaps Template
If you need to explain the digital transformation process and its effects on businesses, consider using roadmap visuals to explain the complexity of the process. The digital transformation strategy PPT template contains slides with digitalization definitions and quotes, development, opportunity and challenges, and diagrams and icons with use instructions.
The digital transformation visuals can be applied in the following cases:
- for educational purposes by trainers, lecturers, or teachers
- in IT project management by leaders or consultants e.g. introducing a new digitalization strategy inside a company or for a client.
- while introducing new tools and directions in a company strategy
Check also how roadmaps can be useful for other strategic presentations.
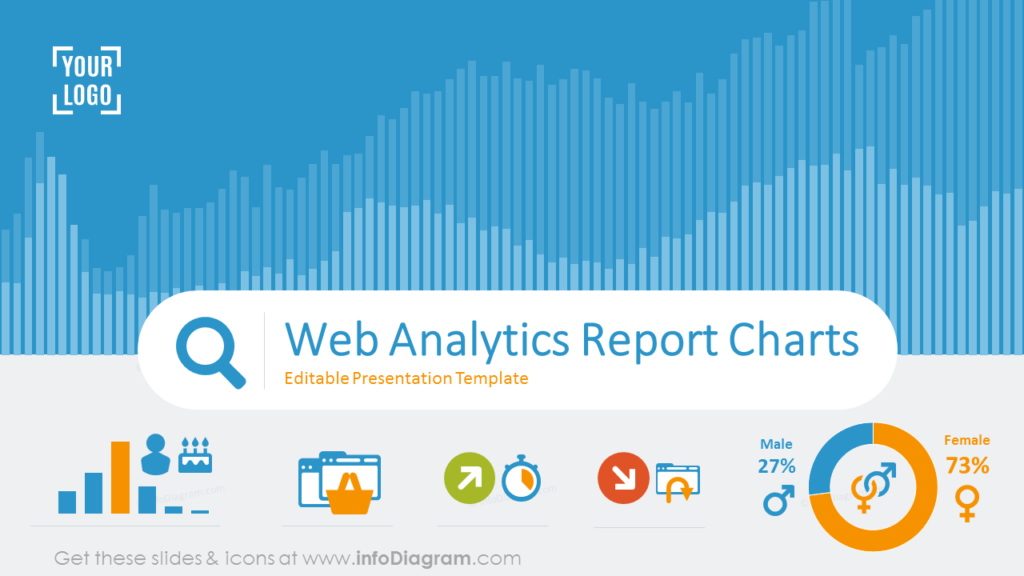
Web Analytics Reports Chart PowerPoint Template
Do you need to present an analysis of the page traffic source and user behavior? The general website health is important for launching advertising campaigns, minimizing the user bounce rate as much as possible, and reducing shopping cart abandonment. Proper communication of those concepts and their statistics to your team is an important step if you want to manage your online presence effectively. The following PowerPoint template was designed to support such presentations.
The web analytics reports charts presentation deck contains pre-designed slides to illustrate Google Analytics findings, pie charts with share traffic sources distribution strategy visualization for improving digital marketing campaign failures, and a calendar for e-marketing project planning. Using such visuals can help you deliver the message to the desired audience in a transparent and understanding way.
This PPT template can be handy to improve understanding and collaboration between the marketing team web data analysts and eventually also developers. Marketers can follow the success of their campaigns, and developers can react promptly to keep the workflow smooth.
OLAP Data Cube PPT Graphics
Are you working in Big Data or explaining Business Intelligence concepts? Do you need to explain its essence, the OLAP cube? In that case, the Online Analytical Processing (OLAP) Template could be most suitable. It contains slides with OLAP definitions, data cube dimensions, cube elements explanation (, visualization of slicing, drill-down, roll-up, and pivot data operations on OLAP, and a handful of icons and graphics for IT analytics.
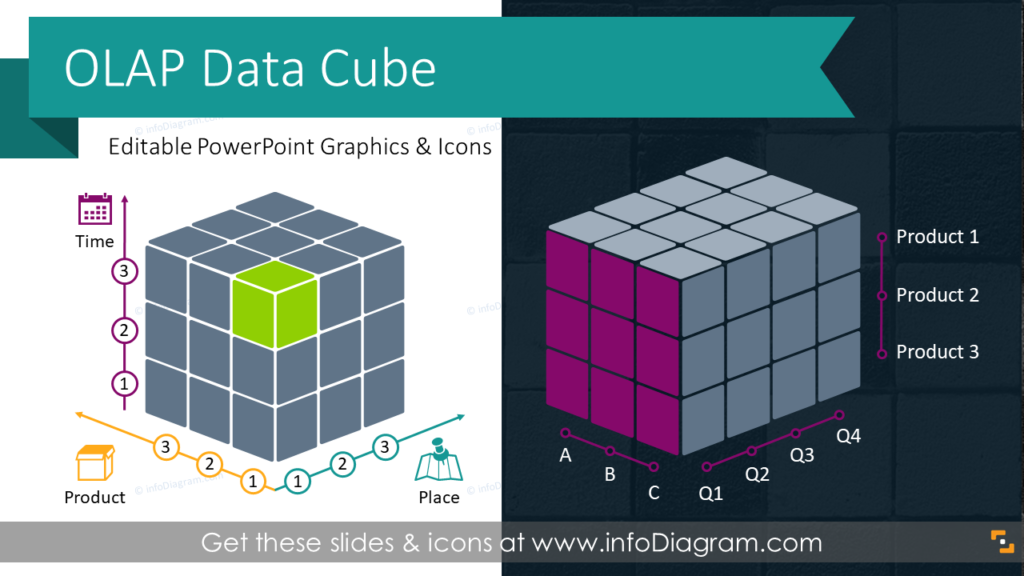
These PPT graphics can help you to explain the OLAP concept to your colleagues, in reports or educational materials teaching data science essentials.
AI & Machine Learning Presentation
If you are presenting topics related to Artificial Intelligence technologies, it’s a good idea to explain those concepts with graphics rather a text-heavy slides. The AI & machine learning PowerPoint template can be a useful help for your presentation preparation.
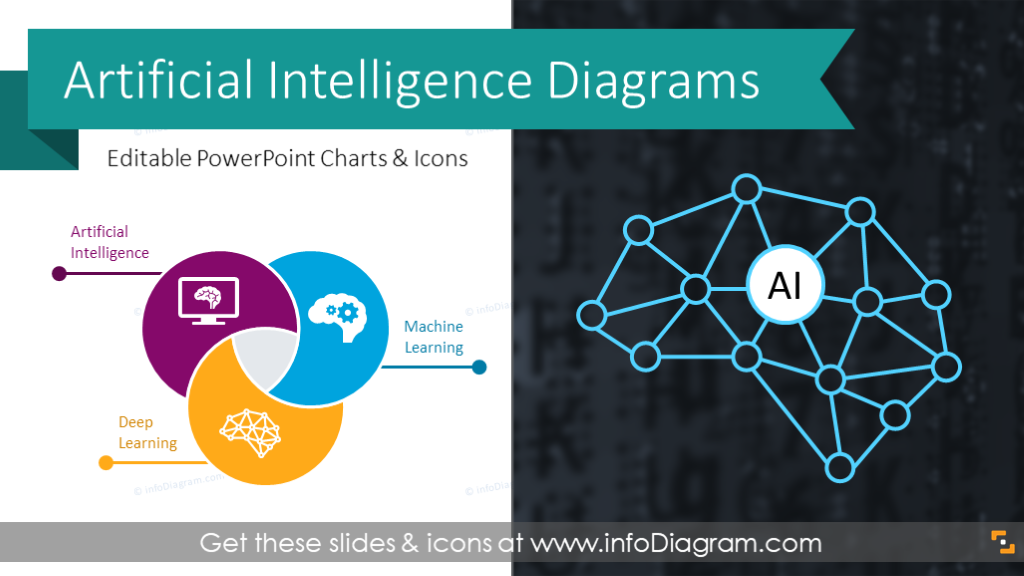
You will find slides with definitions and quotes, AI, machine learning, deep learning comparisons, AI & ML history timeline, opportunities and dangers, and machine learning algorithm types. All slides contain illustrative diagrams and associative icons for presenting this dense information in an easier-to-grasp way.
We recommend you read the following article for more inspiration: How to Present Digital Technology Idea.
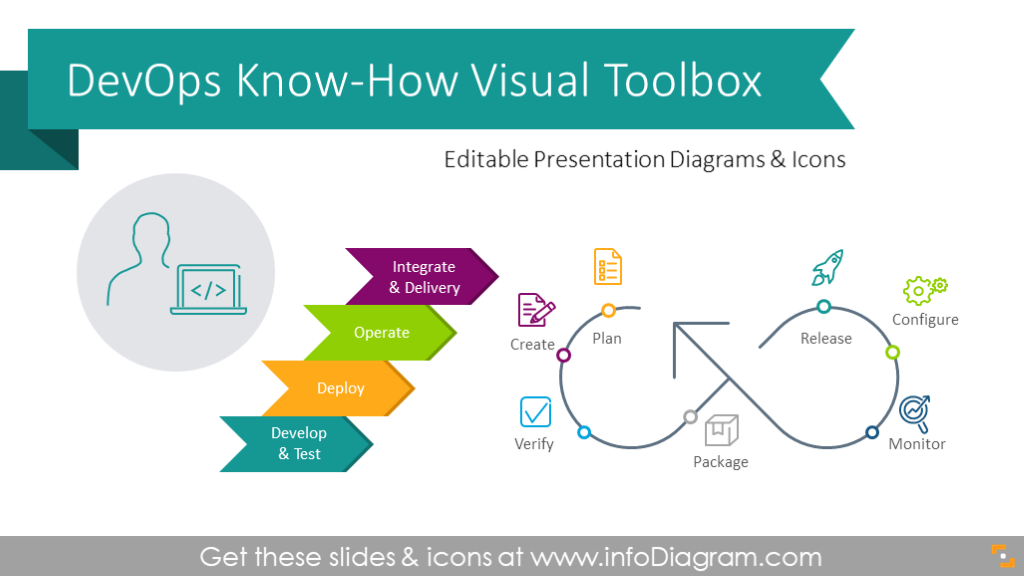
DevOps Know-How Diagrams
Do you work and talk about software development methodologies and processes? Then you can find useful the following DevOps diagrams collection to present it clearly.
Check the PowerPoint graphics we designed to help you visually explain these topics. The DevOps know-how template contains a general DevOps introduction, a circle diagram with touchpoints for presenting the roles, and a honeycomb diagram explaining the advantages without stuffing the slide with text. You can also find flowchart diagrams with the 5 levels of DevOps and 4 phases.
You can further enrich your slides for better visualization with this IT icons bundle set.
Blockchain Technology Diagrams
Are you presenting the Blockchain technology or proposing a new project connected with it? Explaining such a complex technology can be difficult to grasp and often confusing. That is where graphic visuals may come as resourceful. The blockchain technology template contains slides with Blockchain definition, an introduction of how it works illustrated with a roadmap, its structure, key forces, applications, pros and cons, and editing instructions.
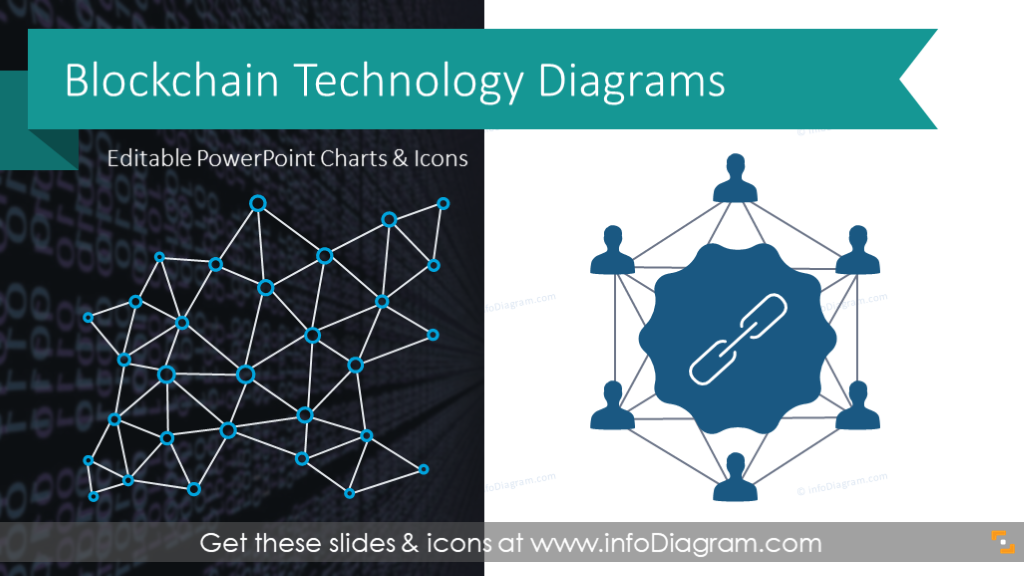
Blockchain is increasingly being used in various industries such as real estate, travel and mobility, shipping and logistics, and product development. Therefore it’s worth having graphics by hand for explaining those concepts to your peers, and clients or for teaching purposes. For more blockchain topic inspirations, refer to this article.
Data Science Analytics PPT Icons
Need an idea on preparing big data, data analysis, or predictive analytics presentations? Using associative visuals will impress your audience and help them stay on the same page. The data science analytics graphics template is a collection of flat outline icons, flowcharts, and circle diagrams for simple concept comparisons such as data science, data analysis, and data mining. Slides with a dark background are also included inside, for more catchy presentations with emphasized elements.
Explore the PowerPoint slide deck mentioned above, it can be a good source for illustrations for data-related presentations, whether you are teaching about it or communicating IT concepts in meetings with your colleagues.
See also how to make Big Data presentation appealing visually in PowerPoint.
IT & Data Analytics Presentations: Choosing the Right Template
We hope these PowerPoint Templates will help you find ideas for your next presentation about digital technologies and IT concepts. Introducing information-dense topics doesn’t need to be difficult if you are using the right visuals.
Our inspiration for creating Data Analytics and IT templates was to help you communicate better, whether you do presentations to teach, inform or sell your IT services or solutions. You can adjust and reuse the slides and their graphic elements for different purposes depending on your goals.
Explore our YouTube channel for more IT related inspirations:
Resources: PowerPoint Templates for IT and Data Analytics Presentations
You can find all the slides we used in this article in the infoDiagram graphics library. You can find many more illustrations to prepare professional presentations to impress your audience. See the whole deck collection here:
Want to test our graphics first? Check out this free PPT graphics sample kit and create unique slides by yourself from scratch.