Making Big Data Presentation Appealing Visually
Are you about to present Big Data or other modern cloud-based IT technologies? You know your Big Data presentation will probably contain various abstract and complex topics that are not so easy to explain using only a verbal form.
Hence it’s a good idea to use some visual thinking to represent how those Big Data systems work, and what are the essential structures and artifacts.
Why apply visual thinking
Creating a graphical representation is a way that helps you make your presentation eye-catching and easy to understand. It can have a form of a handwritten sketch or a simple diagram.
Use visualizations to explain basic computer science concepts and data structures. Show big data dependencies by a flowchart instead of a set of text bullet points. To help you start, here I present several Big Data infographics examples for your inspiration.
Note: All example slides below are accessible in the Big Data Diagrams PPT library (see details by clicking the pictures).
Let’s explore several visualization examples.
1. Introducing the concept – What is Big Data
Every good presentation starts with introducing the topic and agenda. Also in the case of Big Data, you can start with an eye-catching definition.
Here we present a Big Data definition slide with a quote by Doug Laney from Gartner. Adding a quote adds credibility to your presentation.
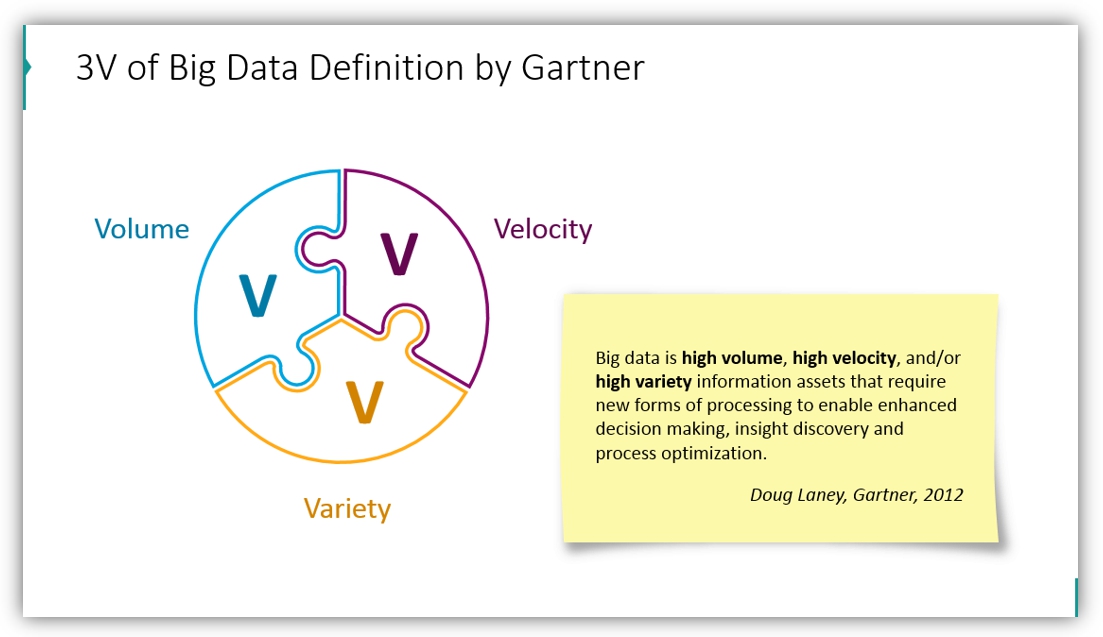
To make the slide more visual, you can add a simple illustration of the citation content or at least put words on some graphical background (for more examples of visualizing famous quotes see this blog).
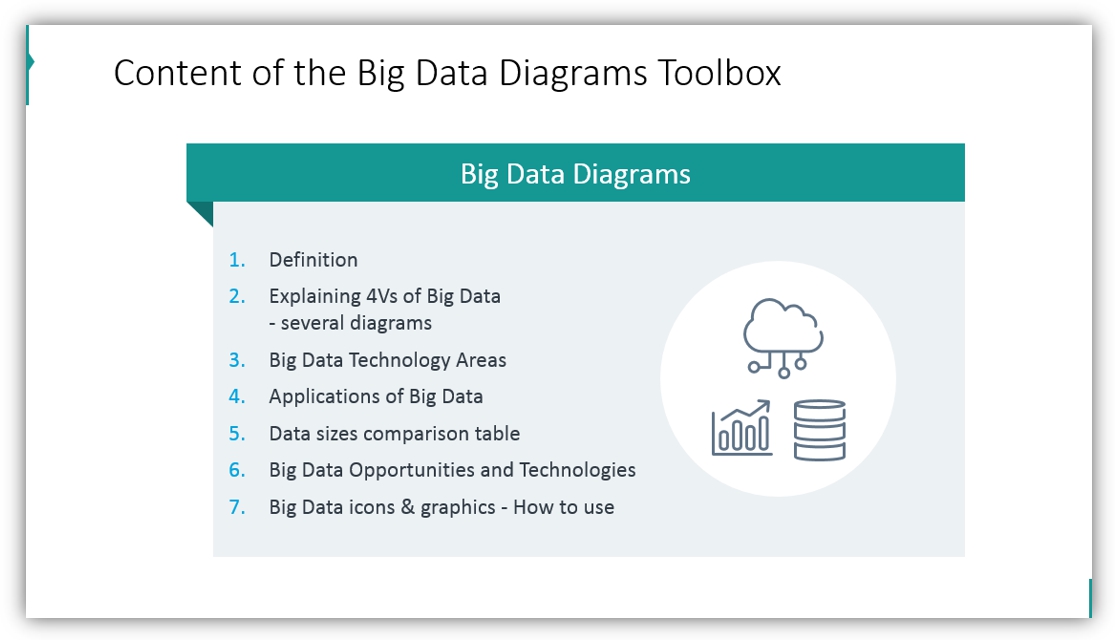
Agenda slide can also be quickly made more visual by adding a thematic icon and some decorative shapes, as we did here:
2. Explaining V’s of Big Data
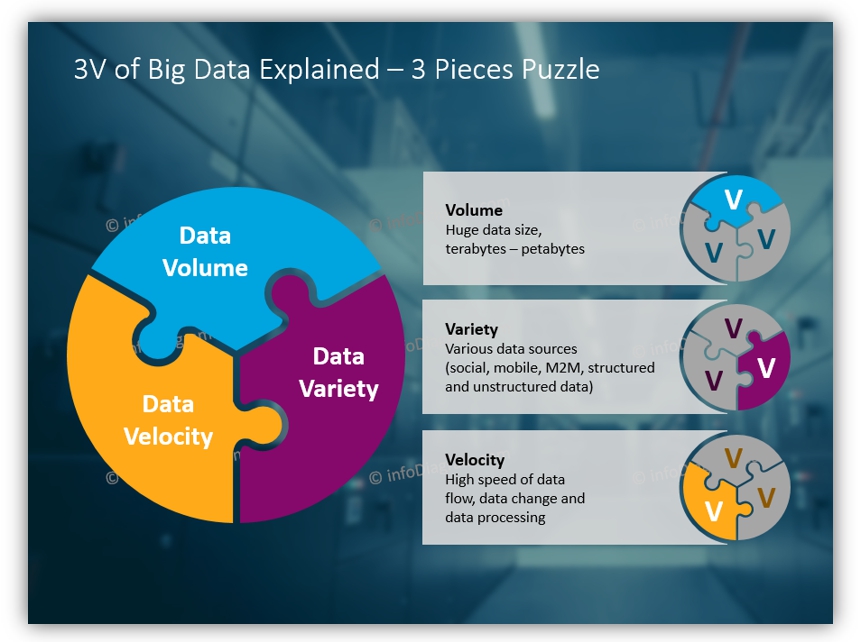
Following the Big Data definition, we can develop further the concept of 3 or 4V’s.
As they are creating a complete whole, let’s represent them by a compact diagram – a puzzle shape is ideal for that.
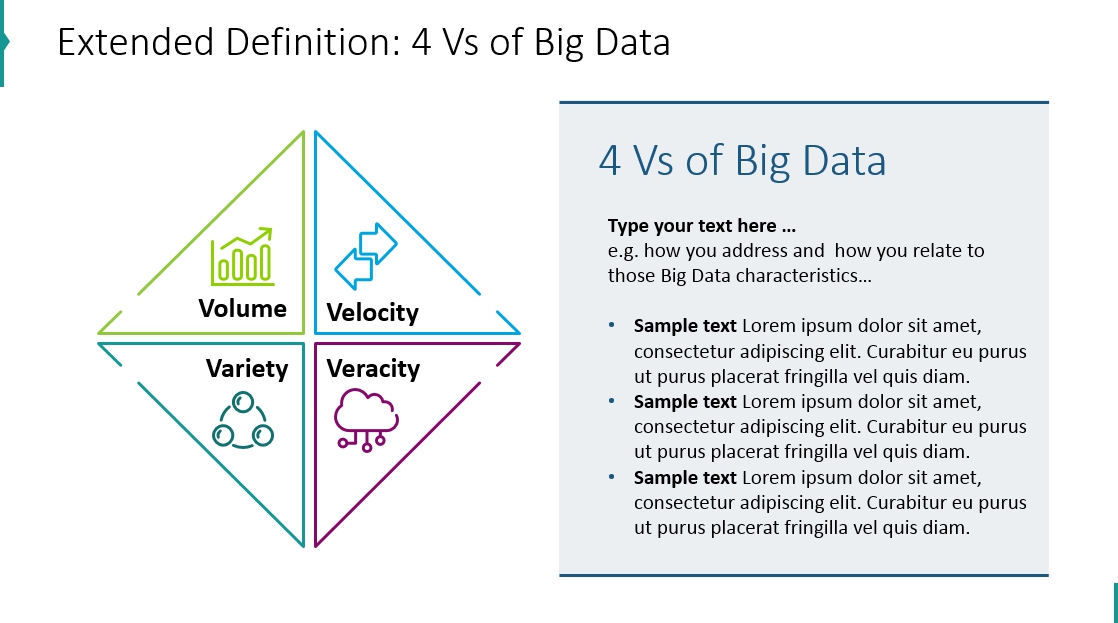
Or if you don’t like the jigsaw puzzle look, use a more simple segmented diamond shape.
To make your Big Data presentation more personal and unique, try to use an organically handwritten style:
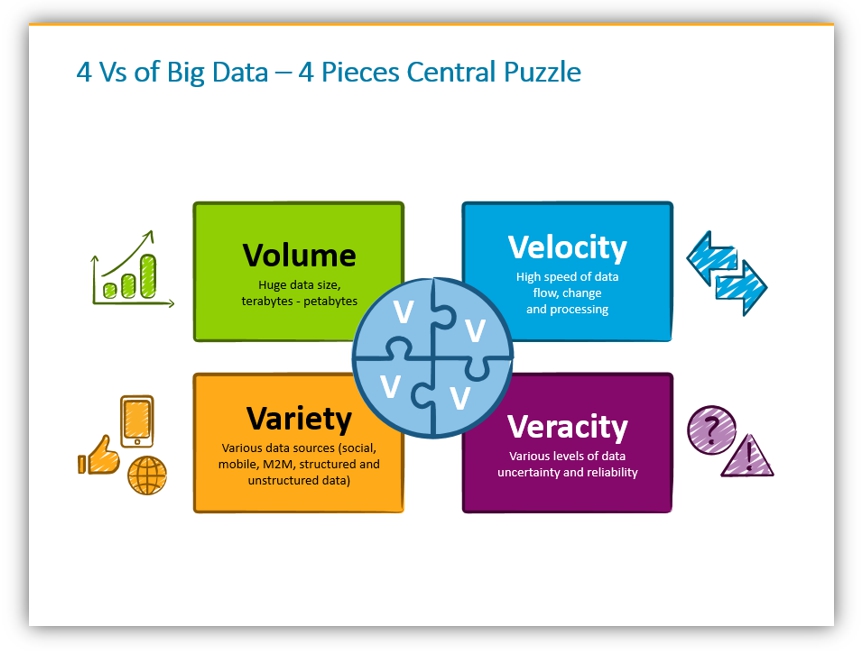
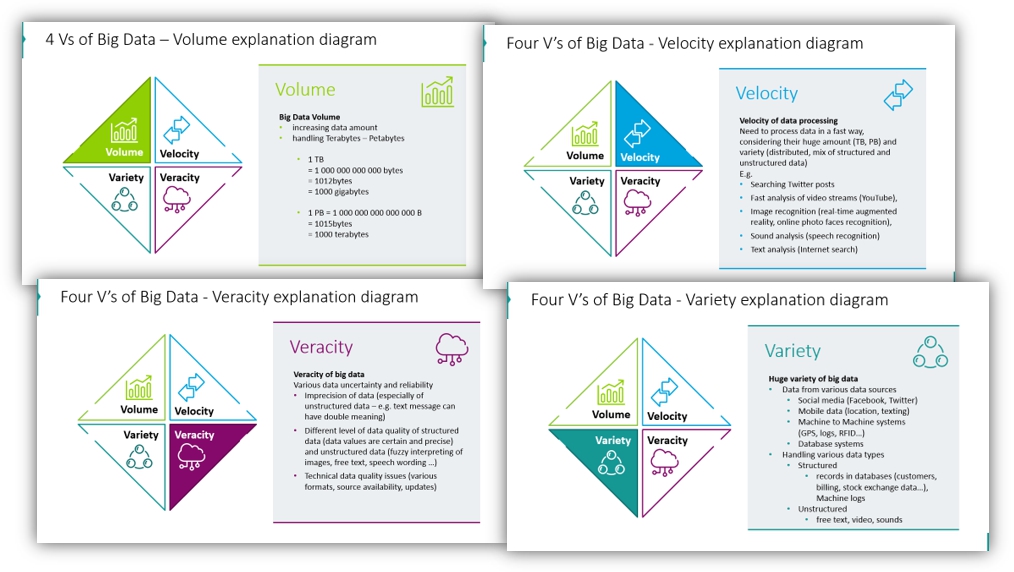
If you need more space to present each V alone, expand it further on the next slides, using the same diamond diagram. Highlight each of the four sections and explain the essence of those data characteristics:
- Big Data Volume item – the ever-increasing amount of data, leading to huge information volumes that need to be handled by data infrastructure and tool.
- The velocity of new information flow and data processing
- Variety of data structures – besides classical organized data formats (databases, forms…) more and more data come in the unstructured form of free text, and social media messages. The challenge is how to extract meaningful information from them.
- Veracity means various levels of data uncertainty and information reliability. Especially in the era of fake news and various unofficial data sources, this is an important issue
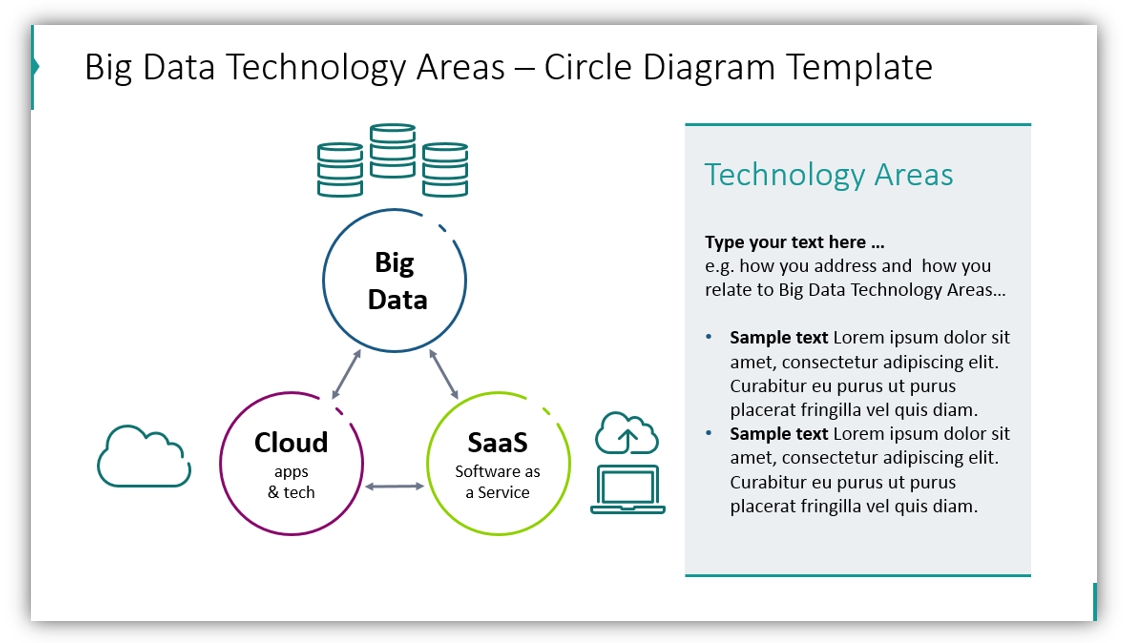
3. Presenting relations between Big Data, Cloud, and SaaS Areas
Another topic you can present visually is relations among concepts such as “Cloud Applications”, “Software as a Service” and Big Data.
If you want to show they are closely related, you can use such a diagram:
or if you like a more creative hand-drawn style, try these graphics:
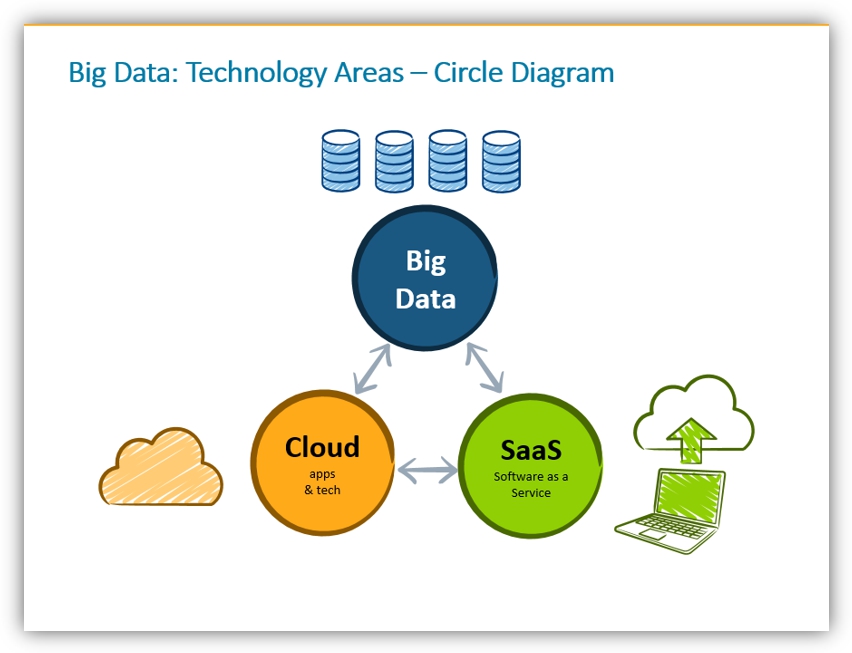
If you want to show another type of relation between those areas, move diagram elements around, and redirect arrows to indicate your viewpoint.
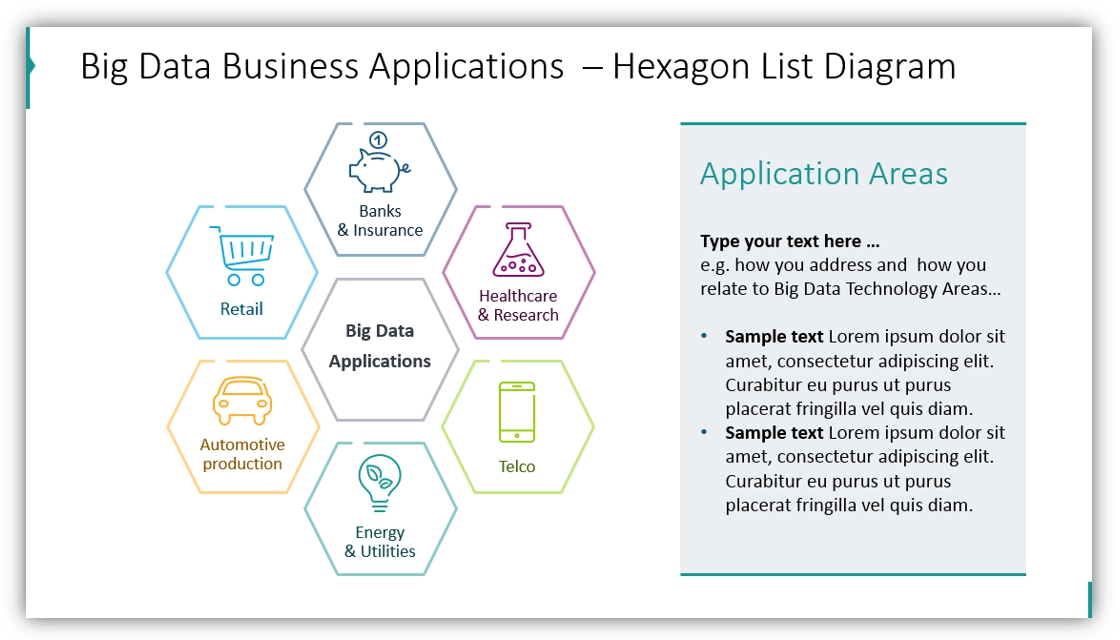
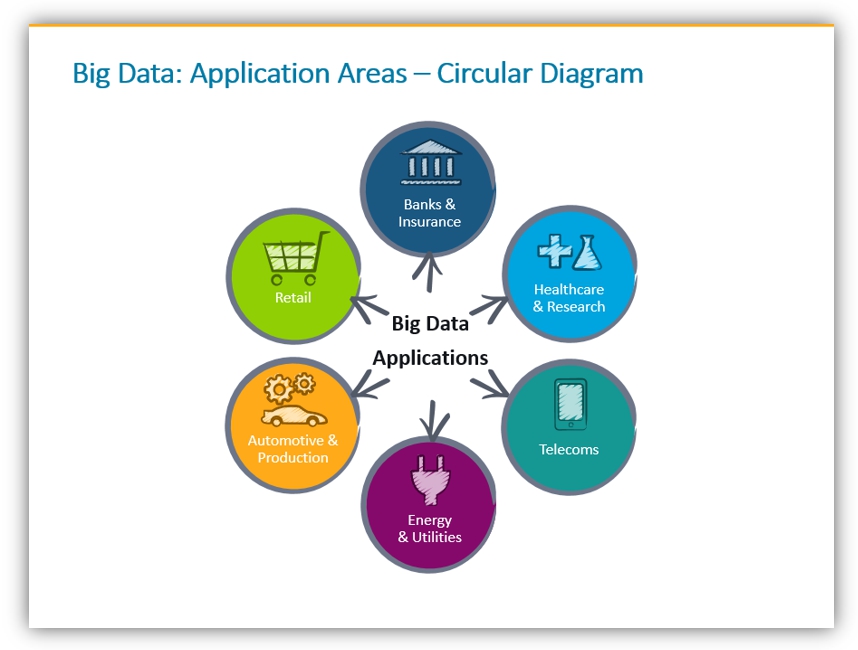
4. Listing Applications Where Big Data can be applied
We continue to see an expansion of sectors where this data technology is applied. It started with strongly computerized industries such as telecoms, but more classical industries are adopting it. To mention a few:
- finance sector – banks (think of various money-sending applications today, compared to paperwork used decades ago), online insurance possibilities
- healthcare and medical research – all those personal smart wearables are using cloud data. Research also benefits from the computational power offered by distributed computing.
- retail also takes advantage of big data technologies on a big scale. A role example is how Amazon leverages the possibilities of the cloud. Amazon actually evolved from e-commerce to one of the biggest data technology providers by offering AWS.
Instead of a standard bullet point listing of those industries, use one of the diagram shapes:
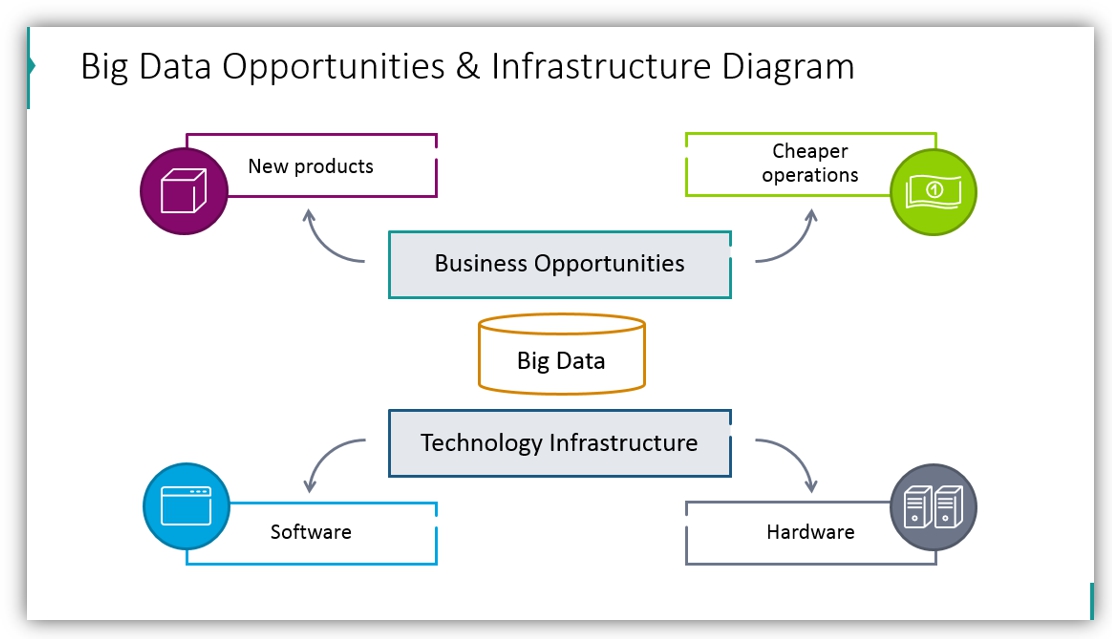
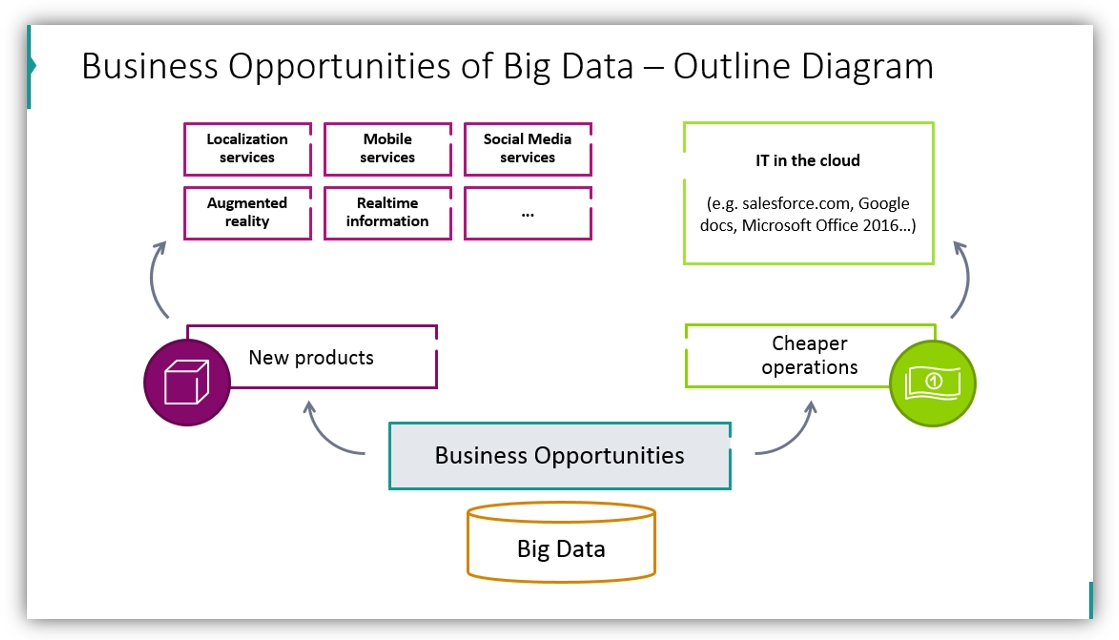
5. Explaining Big Data Business Opportunities and Foundations needed
Big Data definitely is disrupting several markets. However, it needs a proper infrastructure foundation, too. To show both sides of the medal, you can use the following illustration:
Then you can expand on each area. Here’s how you can show new products that can thrive thanks to those new technologies. We mention localization services, and emerging new mobile and social media apps, for example, but feel free to adapt the list to your case.
6. Presenting Big Data Technologies
Big data needs a technical infrastructure to run on, including various software tools that allow us to store and extract the information we need. I would add here Data Analytics & Visualization solutions, and data storing technologies such as Hadoop, MapReduce, and NoSQL. And of course robust hardware – computer data centers, and networks distributed globally and able to send all that data across the world.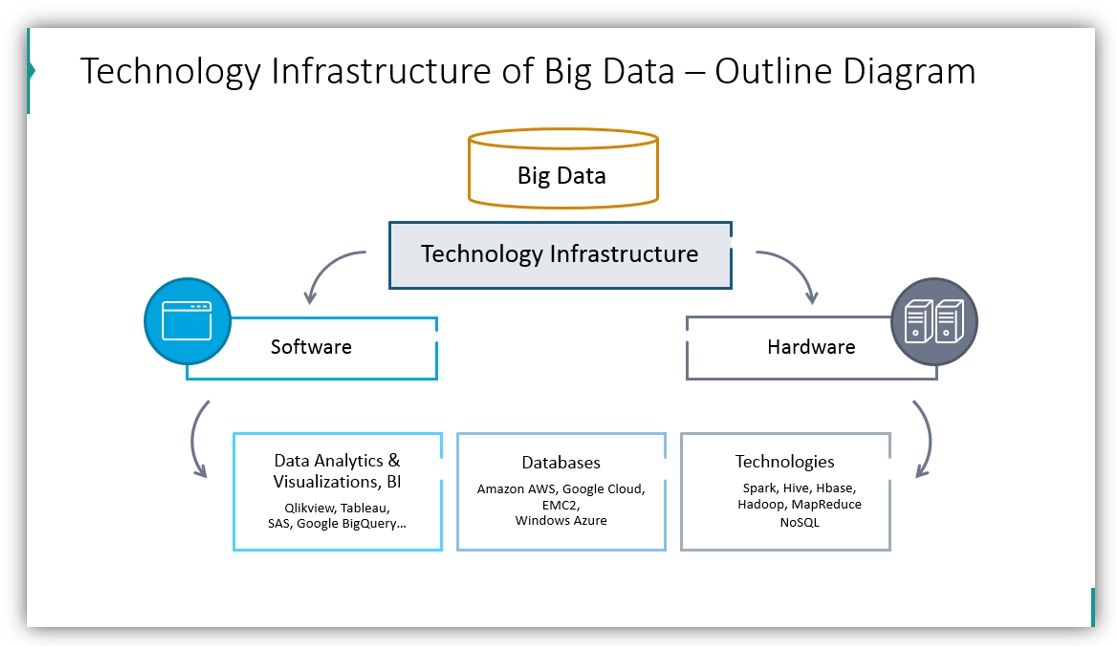
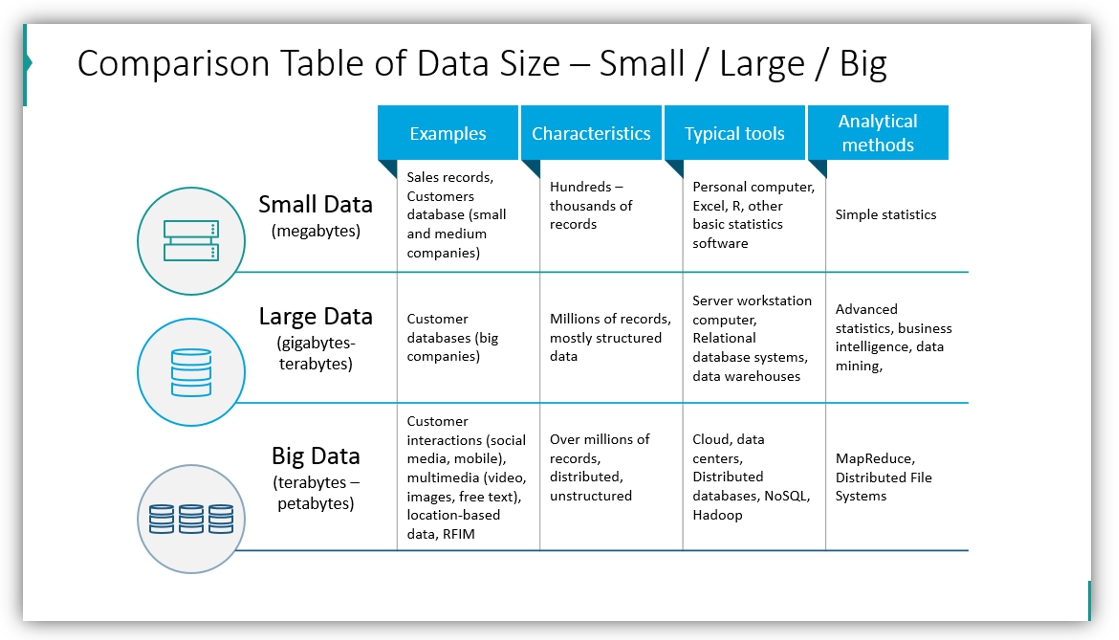
7. Comparing Data Sizes
Let’s make people aware of data volumes – what is small, large, and what is big data? Give examples and compare them side by side in a single table.
Here’s a simple data comparison table you can use. With some light design add-ons you can change a plain table into something less default-looking:
Check this article for more creative designs to visualize a PowerPoint table.
Use the power of visual language
It’s worth spending a few minutes more on the presentation to add there visuals that will underline your message. Using vivid visuals helps to keep your audience engaged and expands their attention span. It does not need to be fancy complex infographics. As you could see, a simple concept diagram will do, too.
I hope those examples inspired you. You can try to recreate them on your own, or make use of our slide-deck template mentioned below.
Resources of Big Data Presentation Visuals
To save you time developing such visuals we designed an editable PowerPoint template with various IT diagrams, flowcharts, and icons. Use these PPT graphics to prepare professional and modern Big Data tutorials and training materials. GO and create engaging infographics.
In case you prefer a less formal sketchy style, check Creative Big Data PowerPoint Visuals here.
The IT icon set can be extended by a wider Flat Icons Library with over 380 visual symbols.