How to Visually Present B2B Segmentation in PowerPoint
Do you want to showcase a B2B segmentation in a visually compelling way? Consider using visual forms such as pyramid charts, matrices, and 3d cubes to present segmentation. It’s an easy way to enhance the visual appeal of your showcase.
We present a few ideas on how to present some of the segmentation approaches to the B2B market, including RFM, Firmographic, and Tier-based framework below.
The visualizations are the result of our slide design experience of presenting various business data, where we, as designers, try to find a balance between showing essential information simply, usability, and attractiveness of presentation. Content was developed in cooperation with our partner, a senior corporate management consultant.
Get all the graphics presented here – click on the slide pictures to see and download the source illustration. Check the full B2B Customer Segmentation Models Presentation PowerPoint Template.
Visualizing the Firmographic B2B Segmentation Data
In the first example, we show how you can visualize firmographic segmentation of the various data categories representing B2B clients such as industry type, geographic location, company size, and annual revenue.
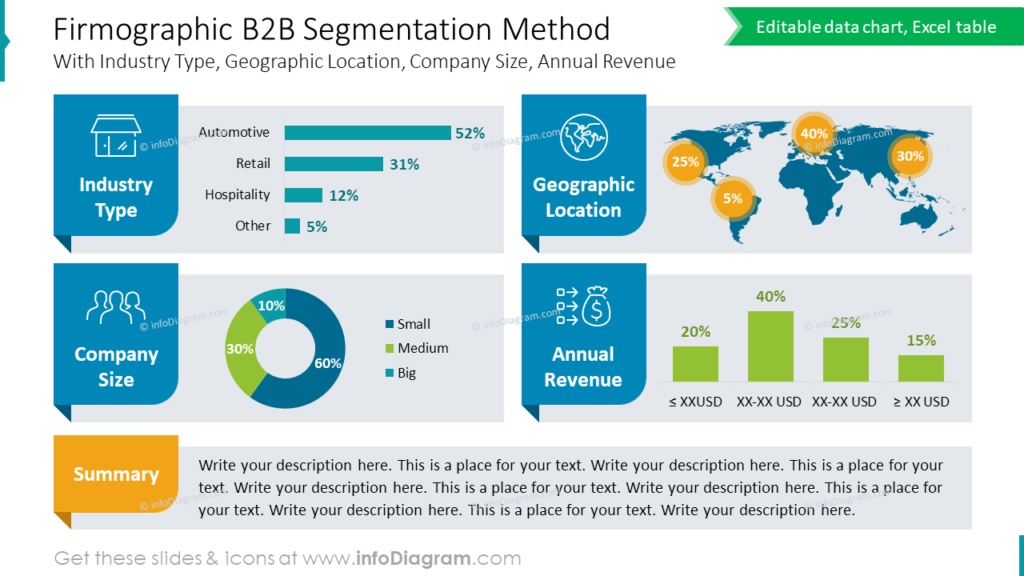
We used different data charts and a map for geographic data to visualize this information. Look at the layout of this slide. Here you can see a lot of data in one slide, but the objects are aligned and colors are consistent, that’s why the slide is easy to read. By charts, we present several B2B segmentation data together in one easily understandable visual slide. Using simple bar charts makes it easier for audiences to read key trends and patterns in B2B segmentation information at a glance.
Additionally, visual elements such as bookmark shapes and icons capture the audience’s attention and keep them engaged during presentations of B2B segmentation data.
Explaining the Essence of RFM Analysis for B2B Segmentation
If you’re looking for slide ideas to explain what RFM analysis is, we have a simple way to show it by diagrams. RFM method is a popular way to segment B2B customers based on their purchase recency, frequency, and monetary value.
Below is our proposal for how you can present visually those 3 categories for clearer understanding. You can see the three columns referring to particular ones:
- Recency
- Frequency
- Monetary
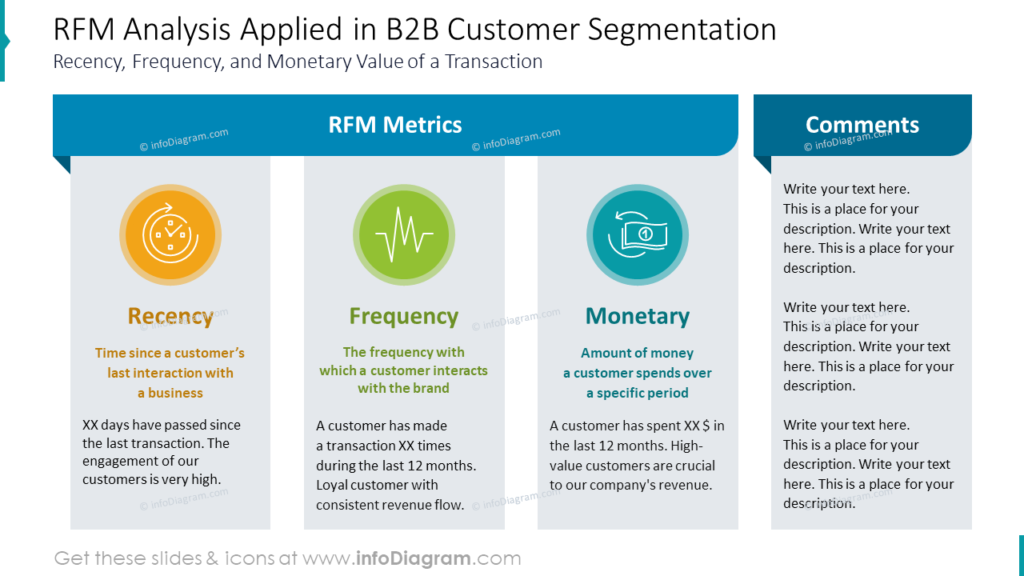
One of the importance of effective design is to arrange content. In the slide picture above you can see two parts of the layout. One of them is the main area with RFM metrics. The second part is the place for some comments, if you want to add some conclusions and additional information.
If you have the analysis of a few factors, we suggest using columns arranged equally. Each of the factors we highlight thanks to adding icons and distinctive colors.
Later you can refer to those icons or colors if you are about to present more specific RFM data.
Illustrating 3-dimensional B2B Client Segmentation by RFM Using Cubes
To present the B2B segmentation of your business customers by RFM segmentation method (recency, frequency, value categories), you can consider using a 3-dimensional segmentation cube. By visualizing segmentation data in a three-dimensional space, you can make a more holistic analysis, understand its position, and uncover trends better that may not be apparent in traditional two-dimensional representations.
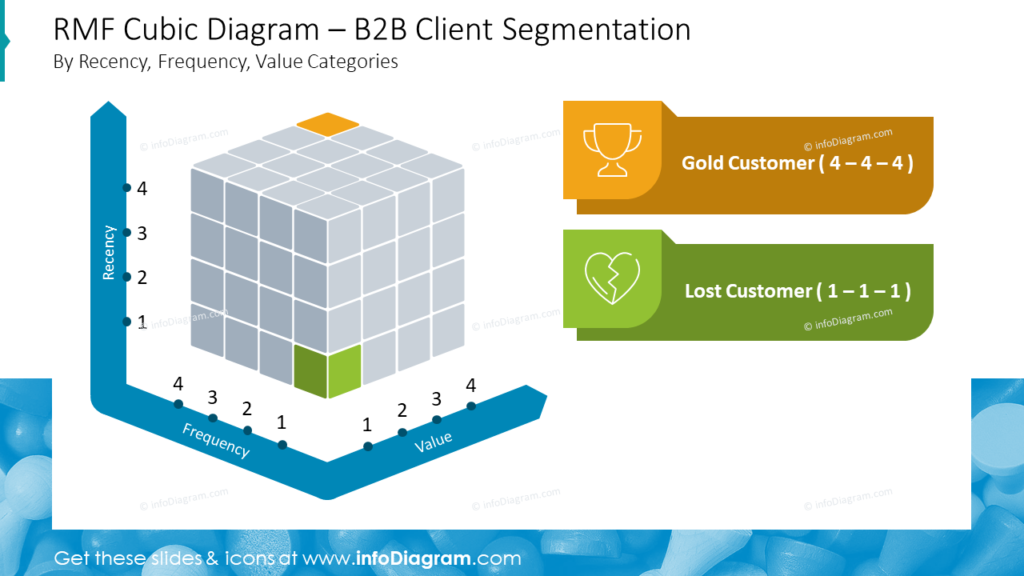
In the slide above we show you how to use a cubic diagram if you need to present segmentation. The use of a 3-dimensional segmentation cube can enhance your presentation. In this case, you can see a sample when we create a 3-dimensional cube using squares. It’s an easy way to show a better segment position.
We created this 3D cube from vector shapes, and thanks to that all shapes are editable. They can be easily recolored to show more segments if needed.
Showing 1-dimensional B2B Clients Segmentation in Pyramid Chart
If you have a simple segmentation based on one main category, you can visualize tiers of such segmentation using a pyramid chart.
See a slide design we proposed for such visualization.
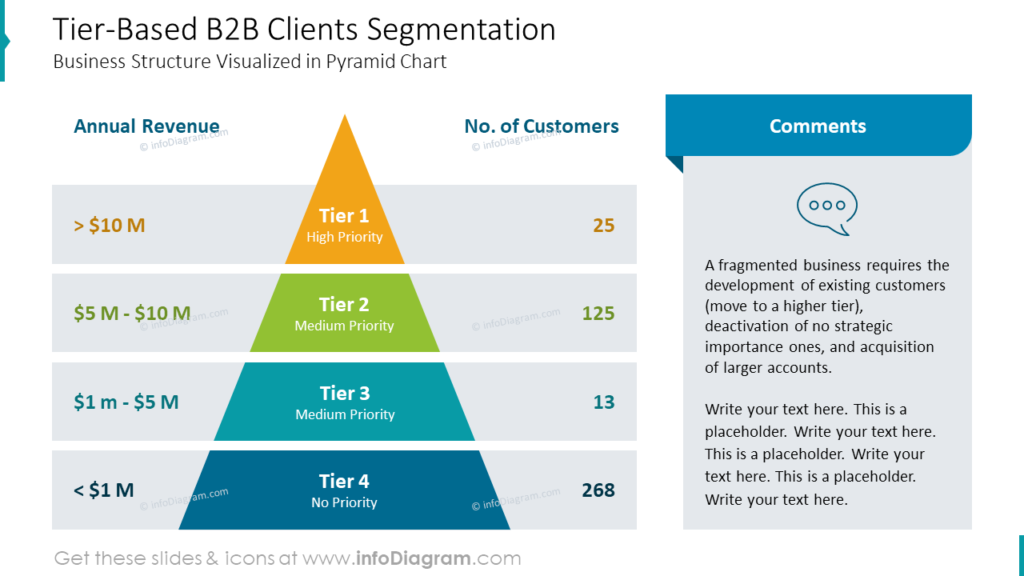
Pyramid charts allow for the hierarchical representation of data. Larger segments at the bottom indicate the lowest revenue values and the business importance of Tier 4. The segment at the top indicated the highest annual revenue and importance of the Tier 1 clients. Those B2B clients are the ones generating the most profit and you should focus most attention on them.
The shape of a pyramid chart naturally draws attention and creates visual impact, that’s why we suggest using it for emphasizing key data points. Here we used a pyramid chart to show the importance of tiers and their associated data such as annual revenue and several clients in the segment. We highlight the most important data by colors and bold. The light gray shapes are complementary to the slide layout. This makes the slide clear and readable.
Key Tips on Presenting B2B Segmentation
When you create your presentation of your B2B client segmentation, keep these simple design guidelines in mind for a clear, captivating, and easily understandable delivery:
- use a consistent graphical style throughout your presentation to maintain visual coherence
- plan the layout of your slides, particularly for those containing a lot of text or data, to ensure a well-balanced and engaging design,
- add icons to enhance the visual appeal of your presentation
- use some special shapes for attracting attention to key points, e.g. pyramid chart or 3D cube.
By following these basic design principles, you can create a compelling presentation that leaves a lasting impact on your audience.
Resource: B2B Customer Segmentation Models Presentation PowerPoint Template
The examples above used the graphics from a PowerPoint template on the topic of B2B customer segmentation. All slides are available in the infoDiagram collection of presentation graphics.
Moreover, you can extend your data presentation with a Point of Sale Segmentation Strategy (PPT Template) right here.


