Making Engaging Employee Appraisal Meeting Presentation with Visual Slides
Are your 1:1s meetings with your employees as effective as they can be? Check how you can improve your employee assessment with the support of visual presentation slides, to have more productive performance reviews.
This helps to make your employee appraisal meeting presentation more engaging – when you show a wider context and future outlook in a visual way.
Get all the graphics presented here – click on the slide pictures to see and download the source illustration. Check the full set of HR Employee Performance Review PowerPoint Presentation.
Typical structure of Employee Appraisal Meeting
Such meetings usually contain the following topics:
- Introduction part, including explaining the purpose of employee’s performance review
- Employee´s scorecard and performance ratings
- Alignment with company values
- Accomplishments during the reviewed period
- Targets overview and goals achievements
- Assessment of employee’s skills and competencies, gaps identification
- 360-degree feedback
- Goals Setting for the future period and employee´s development and Career Plan
What is Employee Appraisal – defining this HR term
When you have newcomers in your appraisal meetings, it’s good to set up a common ground.
Therefore it’s good to add a slide with a brief explanation of what you understood under the term “Employee Performance Review” or “Employee Appraisal”.
You could write it as a plain text definition, stating that:
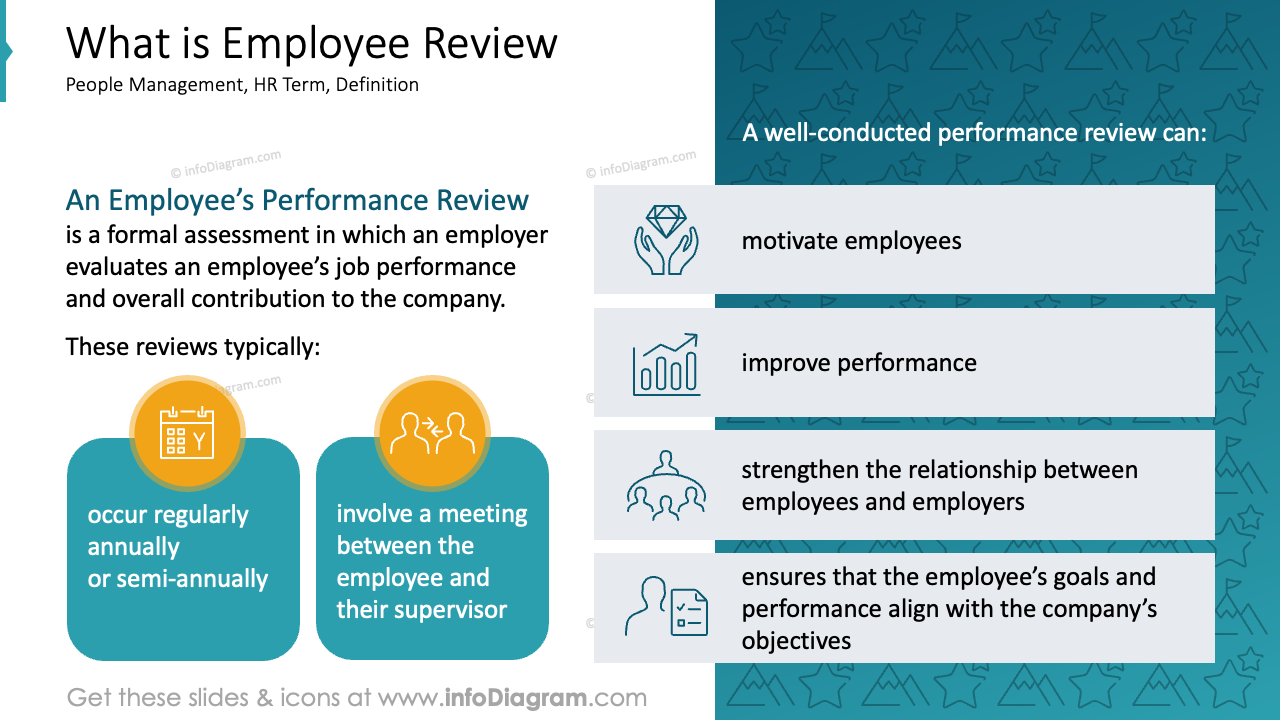
An Employee’s Performance review is a formal assessment in which an employer evaluates an employee’s job performance and overall contribution to the company.
But it’s better to visualize the content of this definition with some graphical elements and to fill the whole slide space. It makes the text easier to read and remember.
Visual Way to Show an Employee Scorecard
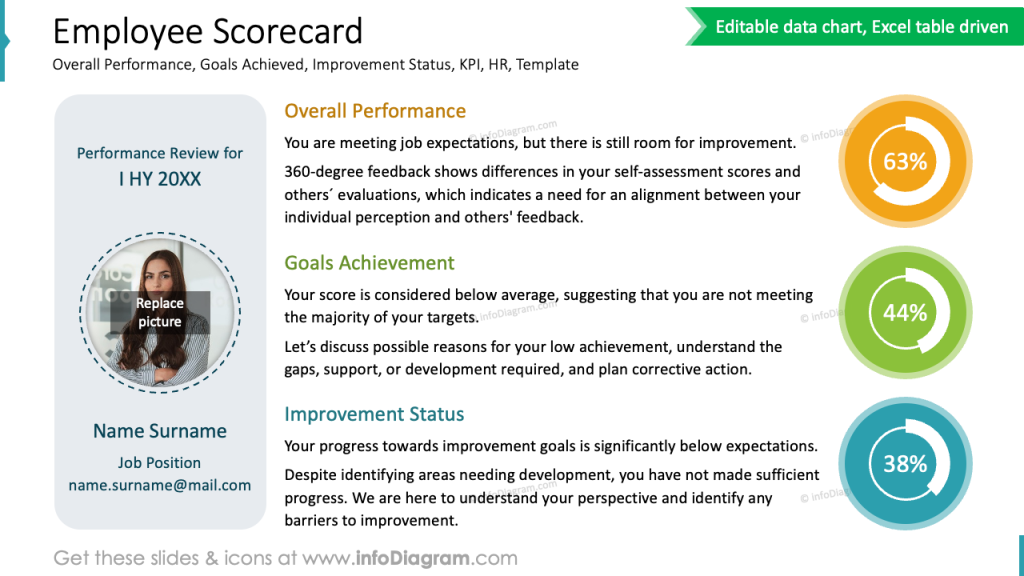
For an employee appraisal meeting, you can create a comprehensive scorecard that summarizes overall performance, goal achievement, and progress on areas of improvement.
Suppose you want to show an employee overview on one slide, in the form of a scorecard. In that case, you can illustrate it this way:
- express main categories such as performance, goals achieved, and improvements status by text associated with measurable data score. Here we show this score in the form of a separate pie chart.
- add an employee picture to make it more personal
- keep the color consistency (each category has its own color)
Using SWOT analysis format for an employee appraisal meeting presentation
We suggest using a SWOT analysis format to highlight the employee’s strengths and areas for development.
You can apply a similar design also to show SWOT of a person, here’s an example of such a slide:
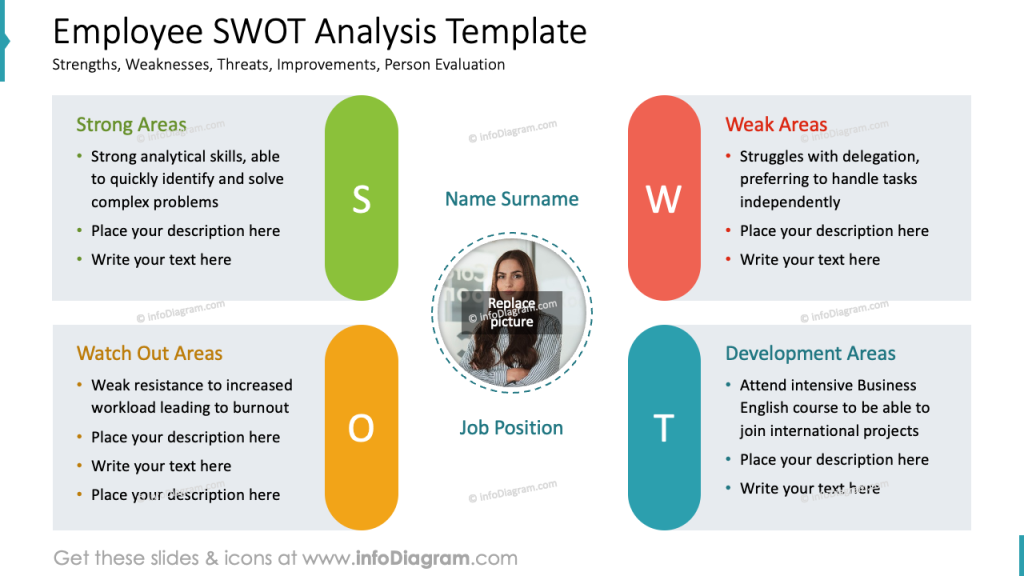
The slide features a visually striking design with a central focus on the employee evaluation process. It’s divided into four quadrants, each representing a key aspect of the SWOT analysis: Strengths, Weaknesses, Opportunities, and Threats.
Such designed slides effectively convey the key elements of an employee performance review.
See other examples of SWOT framework PowerPoint slides here.
Presenting HR Data in Employee Radar charts
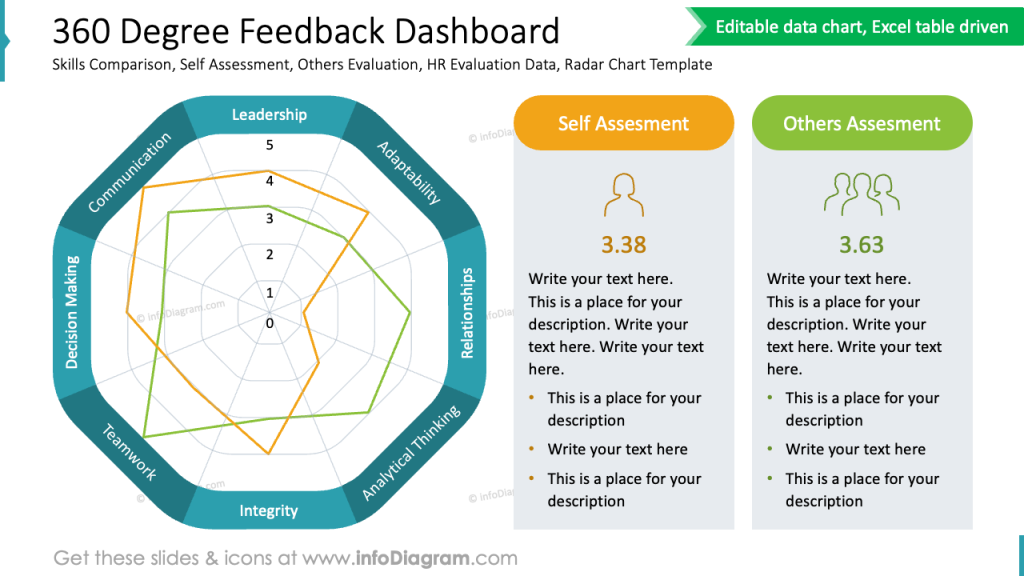
To evaluate the employee’s competencies you can present gaps between the required and actual performance levels using a radar chart. Such a chart shows visually the strengths and areas for development.
What is a radar chart? A radar chart, also known as a spider chart or web chart, is a graphical representation of multivariate data. It displays multiple quantitative variables on axes radiating from a central point. These axes, often called radii, represent different dimensions or criteria.
Here is an example of a radar chart we used for showing 360-degree feedback over several categories such as Leadership, Adaptability, Relationships, Analytical Thinking, Integrity, Teamwork, Decision Making, and Communication.
Additionally, you can add the comparison table to show the average self-assessment compared to others.
You can use radar charts also to visualize HR data such as skills’ importance of: communication, leadership, problem-solving, decision-making, and time management.
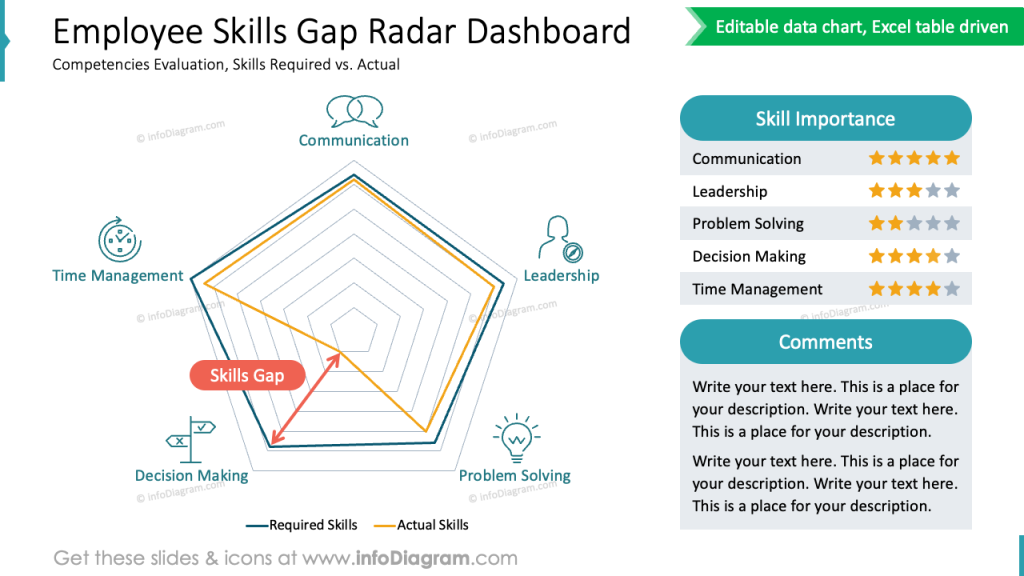
Pay attention to the graphical design of the slide:
- The inclusion of icons – icons next to each skill name adds a visual dimension and helps in quick identification. For example, a speech bubble for Communication, a person for Leadership, a lightbulb for Problem Solving, etc.
- Skill Importance Ratings – the “Skill Importance” section on the right side of the slide uses star ratings to indicate the relative importance of each skill. This provides additional context and helps prioritize development efforts.
Presenting Future Outlook on Employee Appraisal Meeting Presentation
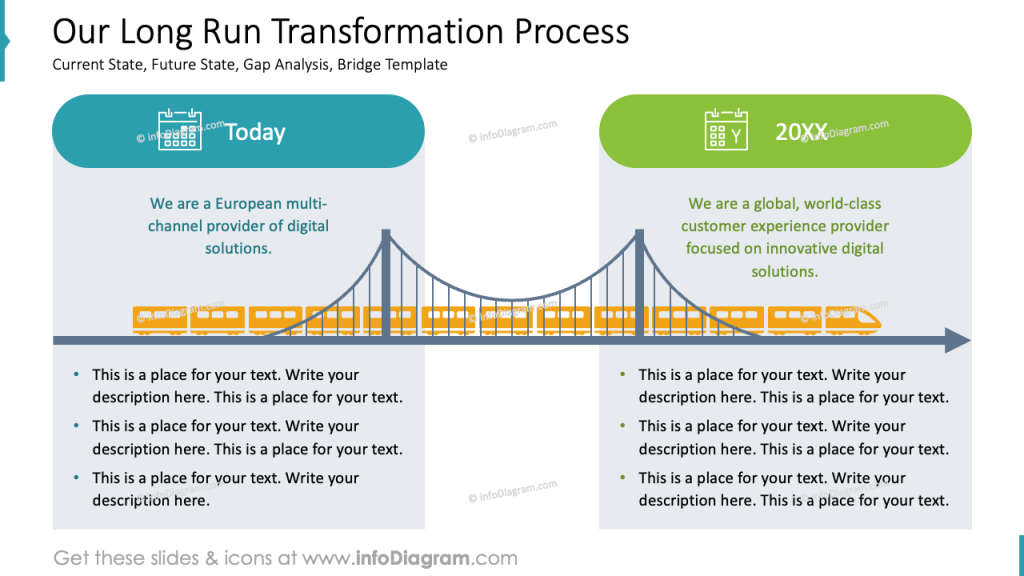
To show possible future possibilities of employee development, you can draw it as a transformation process between Today and the Future state.
An effective visual metaphor for presenting the transformation process can be a bridge graphic, as in the example below. The train connects the actual status with the one that is planned.
Then you can continue
- explaining employee contribution to company strategic initiatives.
- Use that to set goals and performance metrics for the next period.
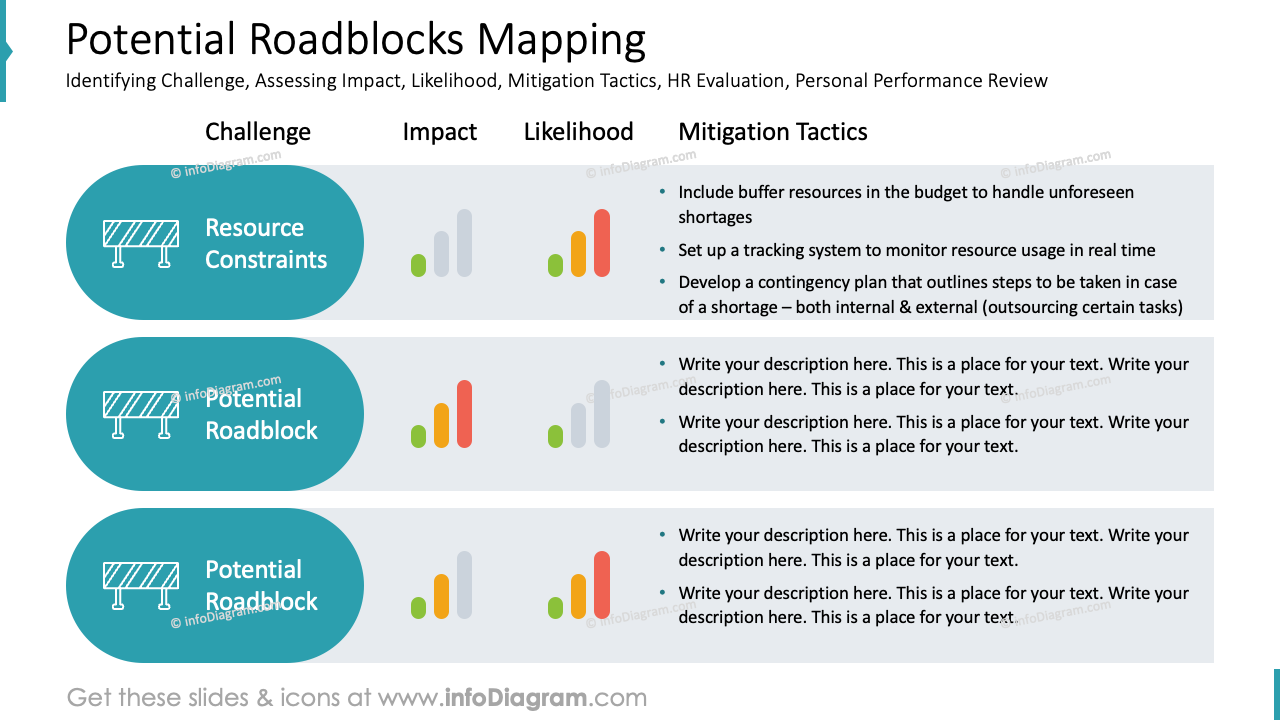
- Identify potential roadblocks towards this future.
Mapping potential roadblocks and challenges during employee evaluation
The last point can be analyzed and expressed as a set of challenges, their impact, likelihood, and mitigation tactics. See how we propose to show that on a slide:
Showing PDP – Planning Personal Growth
PDP – personal development plans should be presented in a timely manner – it’s good to make a specific roadmap for employee PDP areas and assign the time periods.
You can present PDP roadmap for several years ahead, segmented into key areas such as skills, competencies, mindset, and behavior. A convenient form for such a DPD presentation is a table – like in the example below.
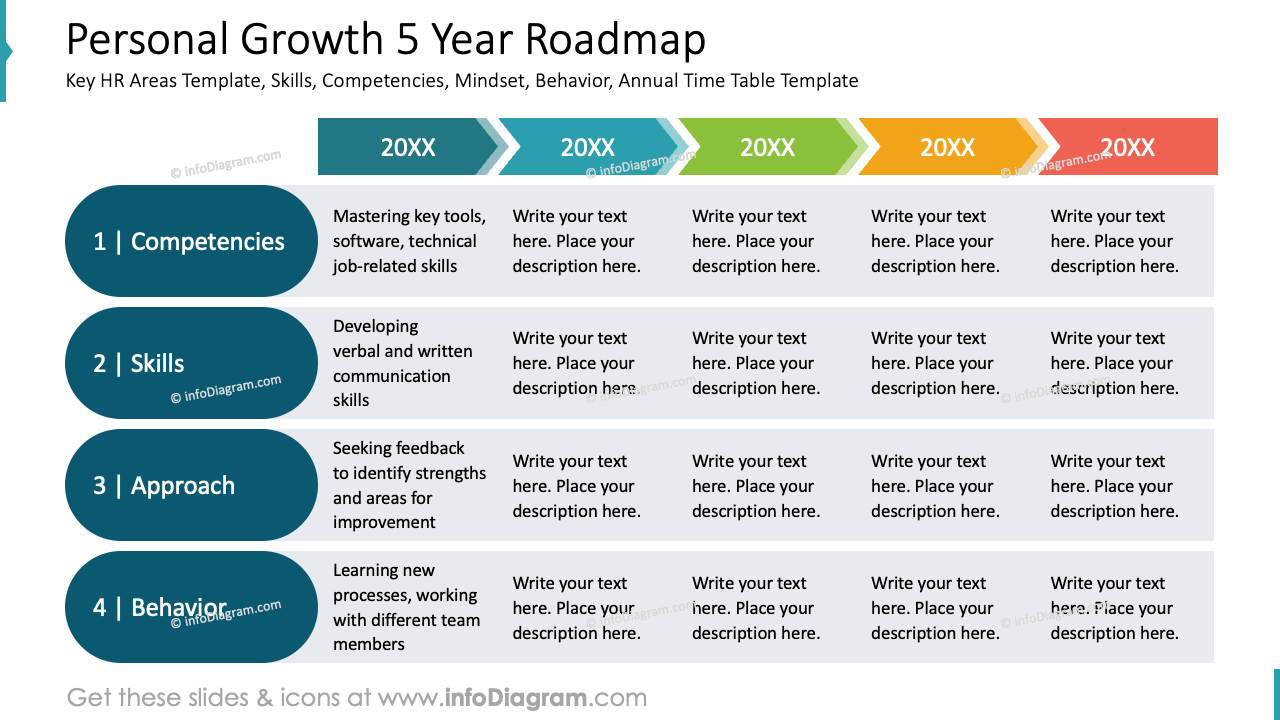
We redesigned the standard table to create a transparent and attractive roadmap by applying a few simple transformations:
- timeline with colored arrows and milestones creates a visually appealing and dynamic representation of the roadmap
- the horizontal layout emphasizes the progression of time and the sequential nature of the growth plan
- each year is represented by a different color, enhancing readability and helping to distinguish between different time periods
Presenting an Employee Career Path
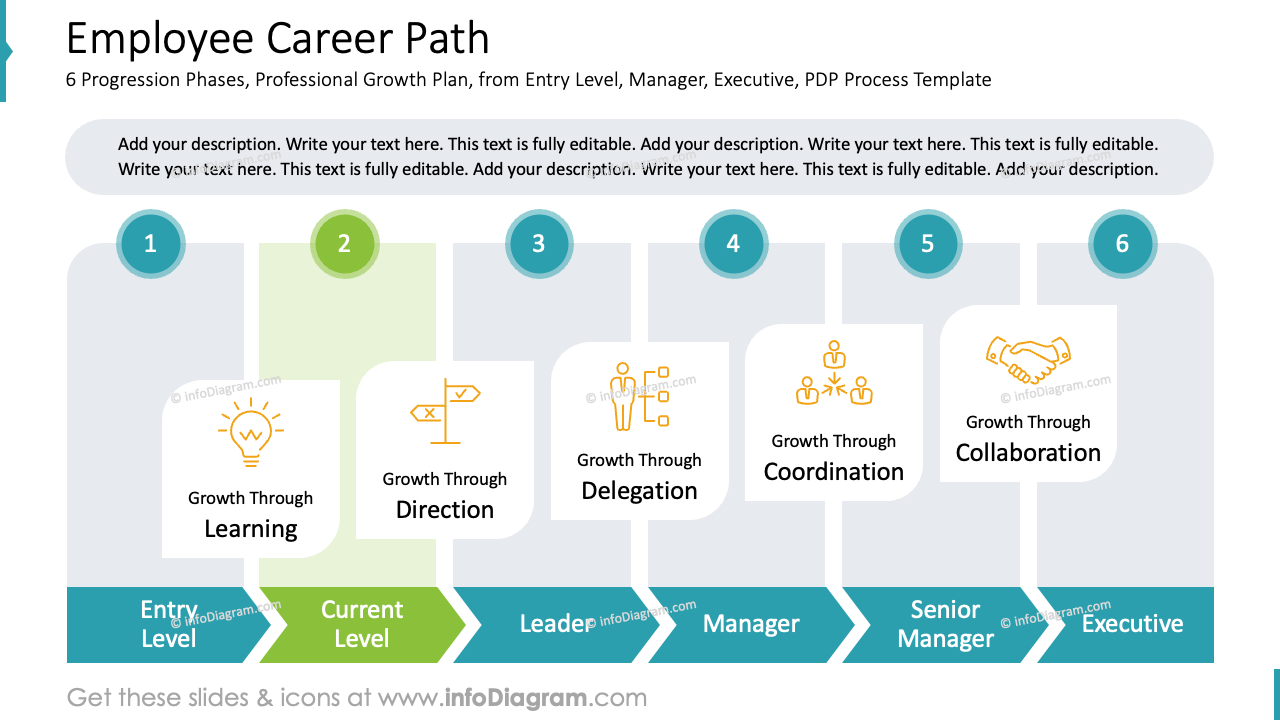
To present the employee’s career path, draw a picture presenting distinct roles and steps of professional growth.
The slide below presents a visual representation of an employee’s career path, divided into six progression phases. The design incorporates a horizontal timeline with vertical elements (we used chevrons) to showcase the different stages of growth.
Also, each phase is associated with a specific icon representing a key growth area eg. the handshake icon symbolizes growth through collaboration and building relationships.
Design hints for an effective employee appraisal meeting presentation
Keep in mind a few design rules to make your employee appraisal meeting presentation professional and good looking:
- Color coding – helps to group related information together, making it easier for the audience to understand the structure and hierarchy of your content
- Icon representation – icons act as visual cues, and are more easily remembered than text alone
- Applying charts – charts visualize data, make complex information more accessible and engaging, and grab the audience’s attention
I’m sure that with these basic design rules and tips, you can make a stunning presentation and overall impression.
Resource: HR Employee Performance Review Template
The slide examples above are from one of our HR PowerPoint templates. Full presentation is available in the infoDiagram collection of PPT graphics:
Watch the presentation video with slide design ideas:
Watch the guide with quick tips on how to transform an ordinary slide into a more attractive slide:


