Four Reasons Any Action Is Better than None (R. Kanter), extended HowTo
This is an another practise of using visual thinking to extract the essence of written word. See how I would illustrate the main idea of the business article about planning activities.
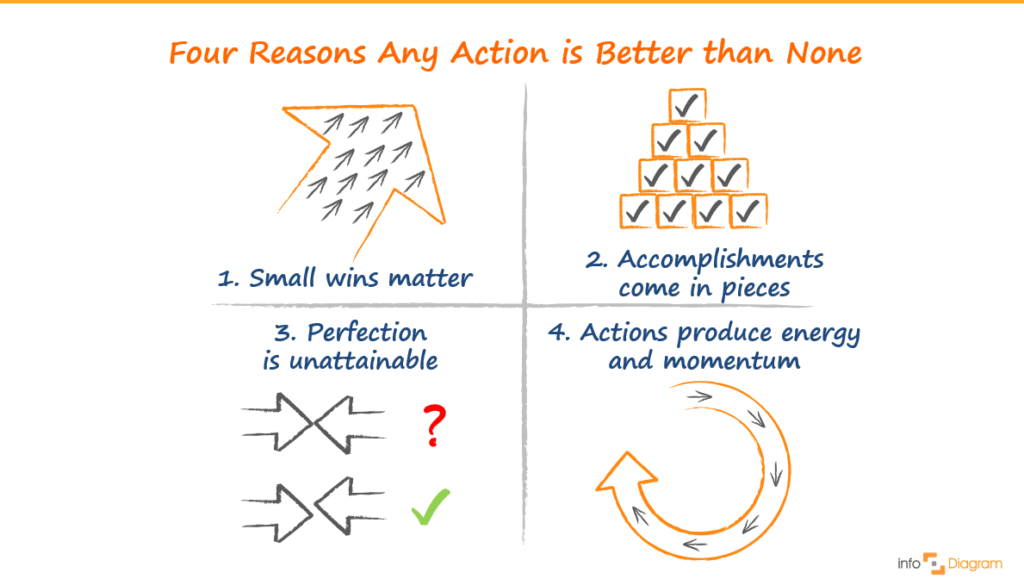
In this artcile I am presenting you an example how to illustrate core ideas from Harvard Business Review article “Four Reasons Any Action Is Better than None” by Rosabeth Moss Kanter (original article here).
My illustration made in PowerPoint is below.
Visualisation and PPT design elements I used are available: www.InfoDiagram.com
My visual thinking process – How I designed it
First of all, I identified the basic structure of the article (after printing article on paper). I analyzed it and finally I got four main messages, clearly separated. In each part I underlined its keywords:
- part 1: “small wins pave a way for bigger wins”, “one win at a time”
- part 2: “in pieces”, “single step … manageable”, “take one more action”
- part 3: “forget perfection”
- part 4: “actions produce momentum”, “activate potential to support actions”
Although, here I had little trouble to clearly distinguish points 1 and 2, which are kind of similar.
Then I looked for keyword synonyms and metaphors:
- a way – a road, move ahead, arrow
- from small to big, synergy – integration, puzzles..
- cumulative – pile, bricks…
- not perfect – fuzzy, blurred, inexact match of sharp objects (arrows perhaps) …
- momentum – ball rolling …
Furthermore, I selected metaphors that could be simply visualized: arrow, bricks, ball.
Finally, I drew it together using shapes and icons from our InfoDiagram collection, not forgetting about good-design rules:
- Firstly, show the reading direction
- Secondly, highlight key parts and keep rest as background
- In addition, leave enough empty space and maintain consistency (limit colors, one style, homogeneous sizes, and shapes)
Further articles on presentation graphics
For more inspiration on using visuals in your presentations, or on how to implement graphics in an engaging way, check out these helpful articles:
- 3 diagram mistakes to avoid in slides design
- Illustrating Strategy in a Presentation [How to visualize a concept]
- 1 message rule for good presentations
Want to be notified about new blog posts on visualization topics? Sign up to our newsletter and get a bonus of free sample diagram PowerPoint graphics.