PEST Analysis and PESTEL Model Infographics Presentation
The PEST analysis is a useful tool for understanding market growth or decline, and as such the position, potential and direction for a business.
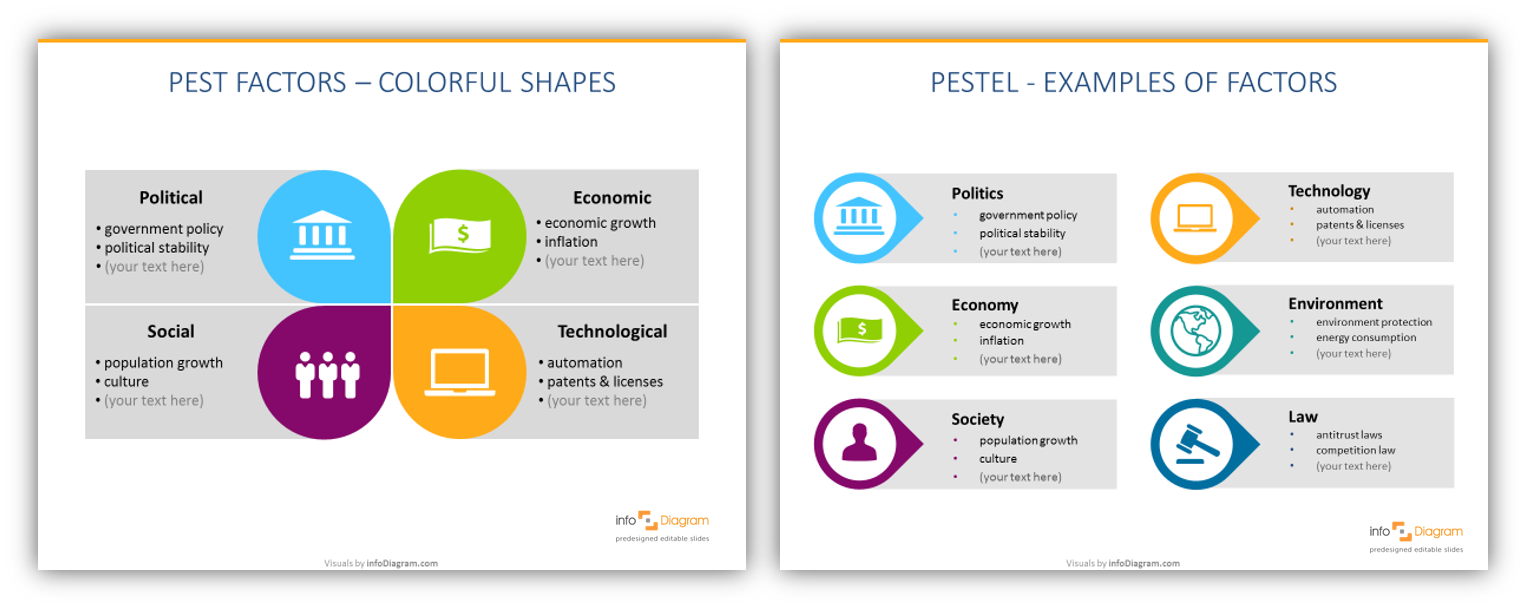
We created a collection of PEST and PESTEL model diagrams, representing PESTEL attributes: Politics, Economy, Society, Technology, Environment, and Law. Presentation template suitable for business analysis and strategy planning presentations. You can use PEST analysis for business and strategic planning, marketing planning, business and product development and research reports.
Remark: You can get all the diagrams and icons from PEST Diagrams Collection.
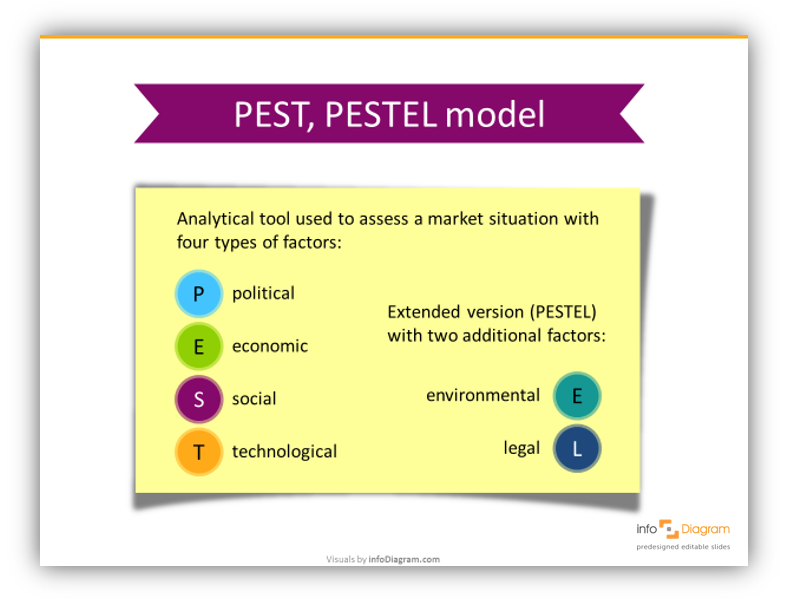
PESTEL stands for:
- P – Political factors are basically how the government intervenes in the economy
- E – Economic factors, which have a significant impact on how an organization does business and also how profitable they are.
- S – Social factors, also known as socio-cultural factors, are the areas that involve the shared belief and attitudes of the population.
- T – Technological factors, which include technological aspects like R&D activity, automation, technology incentives, and the rate of technological change.
- E – Environmental factors, which have only really come to the forefront in the last fifteen years or so. They have become important due to the increasing scarcity of raw materials, pollution targets, doing business as an ethical and sustainable company
- L – Legal factors, which include discrimination law, consumer law, antitrust law, employment law, and health and safety law.
PEST and PESTEL analysis models can be used to check the external market environment:
- when you are starting a new product
- when entering new markets – business sectors or countries
- reshaping your services or products strategy
- changing your product supply chains
PESTEL analysis is described in detail in this article about marketing theories and PESTEL model in particular.
PEST and PESTEL model diagrams collection consists of 16 chart diagrams and 13 icons, which are fully editable as you can see on the slides below:
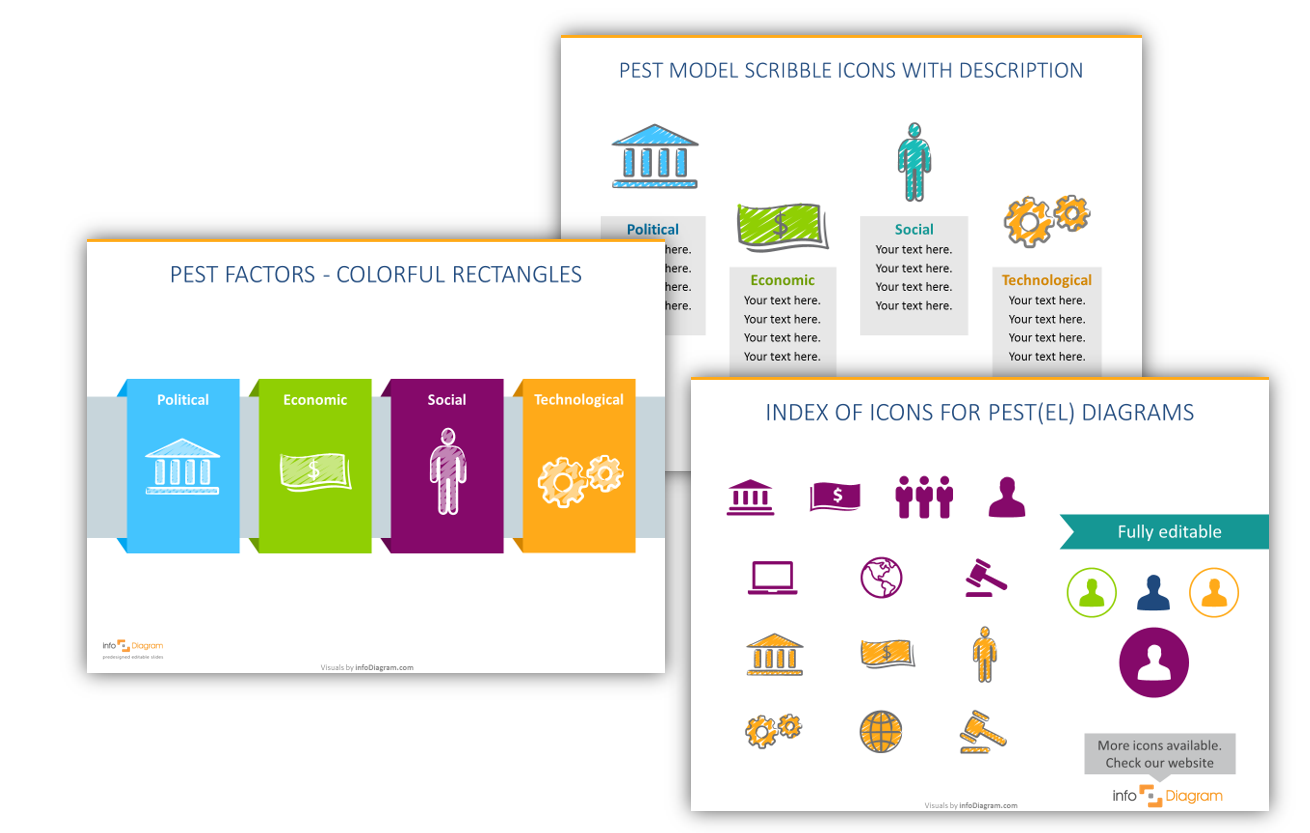
Set contains extendable pictogram symbols of PEST and PESTEL charts in two graphical styles:
- modern flat icons symbols for infographics
- personal hand drawn scribble graphics.
To make your slides stand out we invite you to check our ‘How It Works’ page or demo presentation at Slideshare:
Further articles on presentation graphics
For more inspiration on using visuals in your presentations, check out also those articles:
- How to visualize a concept – Strategy Illustration
- 3 diagram mistakes to avoid in slides design
- Porter’s Five Forces Diagram
The collection contains various diagrams representing PESTEL attributes: Politics, Economy, Society, Technology, Environment and Law. Presentation template is suitable for business analysis and strategy planning presentations:
Get on our newsletter and never miss an announcement. You’ll stay informed about all of our new updates. Plus, if you sign in for our newsletter you’ll get a Creative slide design guide with free hand drawn shapes, absolutely free!


