Finance, Trade, IT Service Industries Presented by Icons
Talking about service industries such as finances, trade, or IT? All those dealing with more abstract concepts than the classical product industries. Therefore it’s harder to present those business sectors visually, to make your presentation more engaging. People respond to visual information faster, thus it’s still worth investing a bit of time to illustrate properly your document.
This is an overview of visual symbols collection for various service industries, which can easily be added to various office documents, including PowerPoint slides, Word documents, webpages or infographics.
(get a version for commercial use here)
Why use a consistent industry icon set?
Some common problems you can face while searching for various industry sectors images are:
- Hard to find a specific icon for your industry
- The inconsistent look of images if you use several resources
- Unclear legal rights for using the icons from the Internet, e.g. author attribution is needed, or pictograms are only for non-commercial private use.
- Symbols may not be editable in PowerPoint
- Icons of lower visual quality (distorted edges)
With our infoDiagram Industry Icons set, we address all those issues. Check the example slides below.
All presented pictures below can be found in the PowerPoint Industry Icon Set (see details by clicking the pictures).
Apply Icons to Enhance PowerPoint Charts
Using simple symbols on the diagram slides will help you to catch and keep the attention of your audience on the points you want, especially if you have to present a large amount of statistical data.
See those examples of bar, pie, and cycle charts:
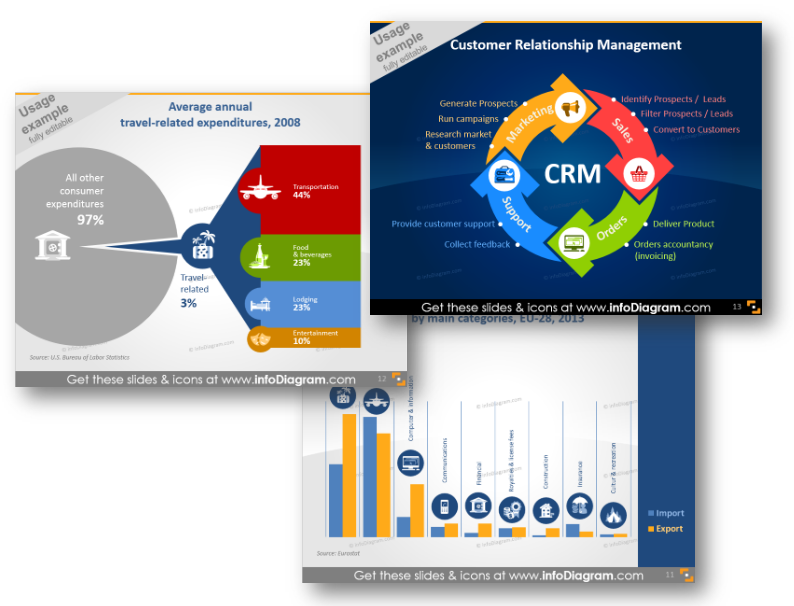
Looks much better, doesn’t it?
Besides adding the icons to PowerPoint slide, you can use them also in other documents – eBooks, Excel sheets, also Keynote, Prezi and other tools. For MS Office apps a simple copy & paste of the data chart or symbols will work. For other tools (Canva, Prezi..) saving icons as an image and adding them as a picture will do the work, too.
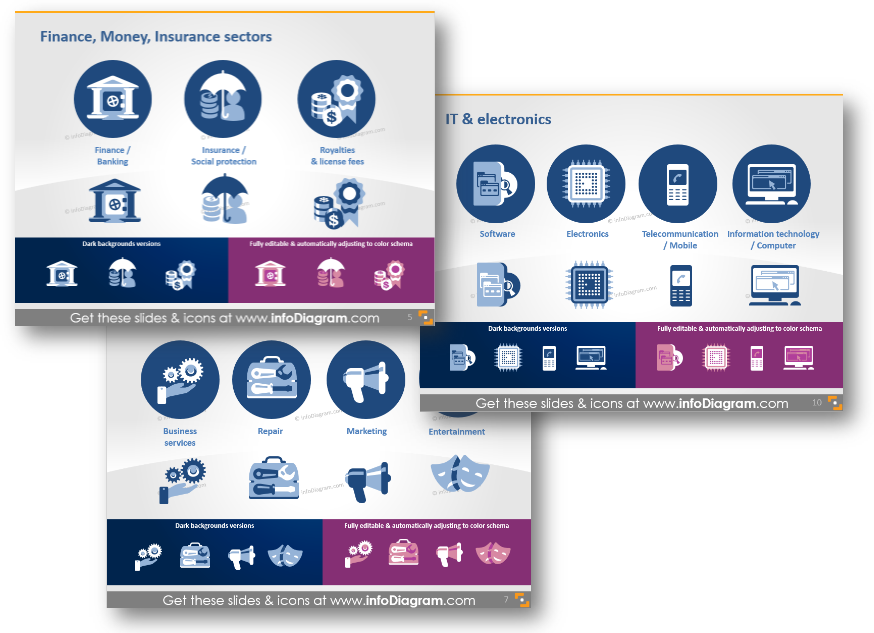
What’s inside the Finance, Trade, Services, IT icon set?
The set contains modern, flat symbols which are all presented as editable vector artwork. You can choose colors to correspond with your brand, the color scheme, and the layout of your presentation, or create natural-looking icons with numerous colors. All symbols, charts, and diagrams are editable vector artwork so you can adjust them as needed, using standard PowerPoint tools. And they remain razor-sharp also if you resize them, unlike bitmap pictures.
The icon collection consists of:
- Finance, money and insurance sectors: banking, social protection, royalties&license fees
- Trade: distribution, retail, real estate
- Services: business services, repairing, marketing, entertainment
- Transport and travel: tourism, hotel, transport
- Leisure: recreation, restaurants
- IT and electronics: software, telecommunication/mobile, electronics, information technology/computer
Finance, Trade, Services, IT icon collection is a part of wider industries icons bundle, which contains various industry segments pictograms.
All icons and chart examples above are from our infoDiagram PowerPoint Diagrams collection. It contains icons for visualizing economic and industry-specific topics, which can be easily edited and added to other presentations.