Industry Icons Overview: Production, Construction, Transport Sectors
Working in production or construction economy sectors? Having a presentation about FMCG products and their supply chain?
It’s worth to illustrate your topic with visual symbols, to make your documents look professional and easier to remember.
This is an overview of PowerPoint Industry Icon Set (see details by clicking any of the pictures).
The icons can easily be added to various documents, including PowerPoint slides, Word or Excel documents, even web pages or infographics.
Example: Using icons to enhance data charts
Adding industry-specific symbols to the presentation charts will help you to keep the attention of your audience on the points you present. This works especially if you have to present a large amount of statistical data.
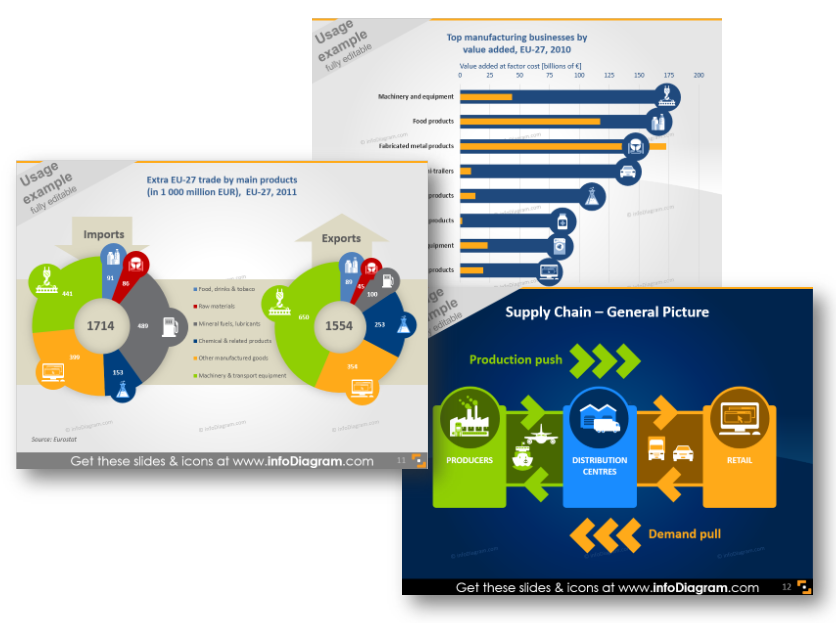
Check those bar, pie chart examples and the supply chain flow chart enriched by flat-style icons.
Such charts look much better than default charts, don’t they? So even boring statistics can look creative 🙂 Everything that we did here were: adding colors, icons and shapes (e.g. arrows) and the slides became more vivid looking.
Besides adding the icons to PowerPoint, you can use them also in other documents: e-books, Excel sheets, for example. All icons can be imported also to other presentation tools such as Google docs, Keynote, Canva or Prezi. For MS Office apps a simple copy & paste of the data chart or symbols will work. For other tools (Canva, Prezi..) saving icons as an image (see tutorial) and adding them as a picture will do the work, too.
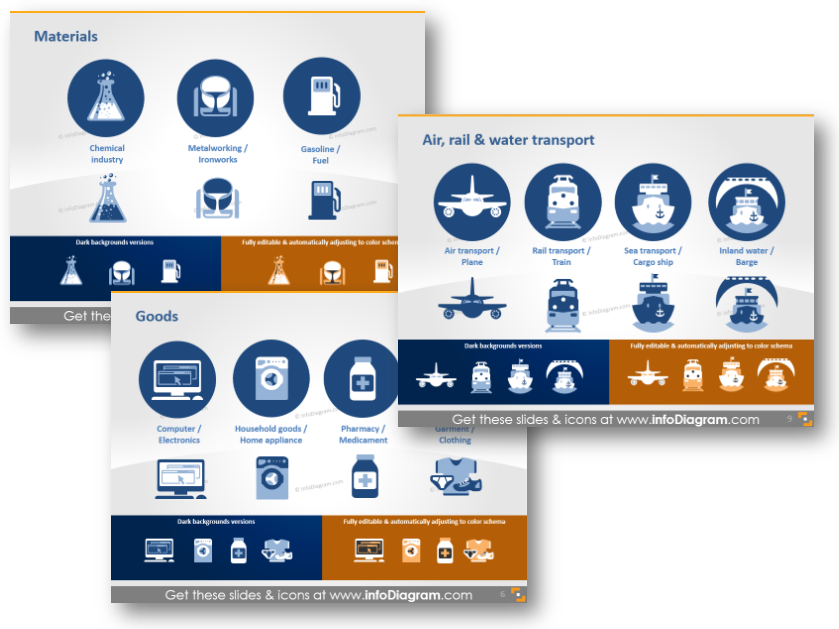
What’s inside the Production, Construction, Transportation icon set?
The collection contains modern, flat symbols which are all presented as editable vector artwork. You can choose colors to correspond with your brand, the color scheme and layout of your presentation, or create natural-looking icons with numerous colors. All symbols, charts and diagrams are fully editable so you can adjust them as needed, using standard PowerPoint tools. And they remain razor sharp also if you resize them, unlike bitmap pictures.
The icon collection consists of:
- Production industries: Production, Manufacturing, Chemical industry, Metalworking, Construction, Gasoline, Fuel symbols
- Goods industry: Household goods and appliances, Pharmacy, Computers, Electronics, Garment, Clothing symbols
- FMCG production: Food FMCG, Alcoholic beverages, Tobacco symbols
- Storage and motor vehicles transport: Transport, Storage, Automotive, Car, Truck, Road transport, Public transport, Bus symbols
- Air, Land, Water transport: Air transport, Plane, Rail Transport, Sea transport, Cargo ship, Barge, Inland symbols
- Industry Icons usage examples (Do it yourself infographics):
- Top manufacturing business sectors by value added, EU-27,
(bar chart with icons illustration) - EU trade import/export by main products
(pie charts with icons illustration) - Supply Chain – General Picture illustration
(infographics with icons)
- Top manufacturing business sectors by value added, EU-27,
What’s best: One, Ten, or All the Icons?
Want to try out those icons? You may do so by purchasing a packaged set, by ordering a subscription and choosing several or by purchasing an individual slide ‘a la carte.’ You may be wondering how these options work.
- Purchase a specific Production industry set.
- Purchase a bundle of all industries icons set. With this option, you receive all of the icons for lower cost.
- Picking a single slide with icons using one-time or recurring slides Subscription Access. With this option, you can pick any number of slide graphics you would like to purchase from ANY of our collections and then download the ones you would like – even if they are from different sets!
If you have any question or suggestions, leave us a question here, we will gladly help you.


